Getting Started
The user inputs, outputs, and control elements on the NGT have been redesigned to deliver a cohesive user experience across the various tools. The aim is to present users with only the most essential decisions and data points.
In this section, we will guide you through the basic usage and discuss components of the website using T Cell Class I prediction as an example.
Input Sequence Formats
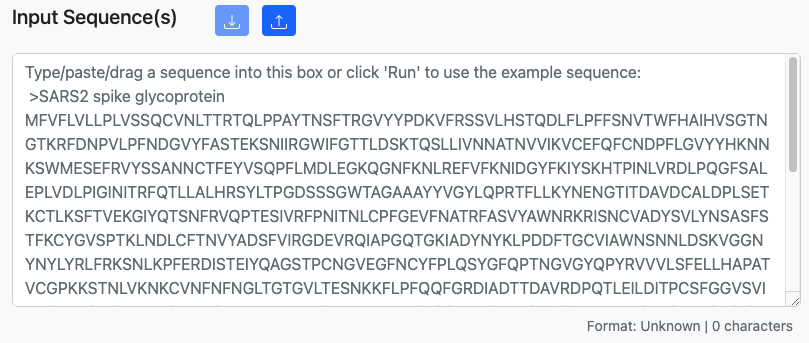
Many of the tools on the site take sequence data, such as proteins or peptides, as input. A typical sequence input box is shown below.
Drag-and-Drop
The input box supports drag-and-drop functionality. Simply, drag over the file anywhere inside the input box and drop it.
The input box will accept sequences in several common formats.
FASTA
The FASTA format is a widely used,
loosely defined standard for representing amino acid and nucleotide sequences.
It generally consists of a descriptor line beginning with a > and containing
a sequence title, followed by 1 or more lines of amino acid/nucleotide sequences.
Example:
>seq1
LKCFGNTAVAKCNVNHDAEFCDMLRLIDYNKAALSKFKEDVESALHLFKTTVNSLISDQ
LLMRNHLRDLMGVPYCNYSKFWYLEHAKTGETSVPKCWLVTNGSYLNETHFSDQIEQEA
DNMITEMLRKDYIKRQGSTPLALMDLLMFSTSAYLVSIFLHLVKIPTHRHIKGGSCPKP
HRLTNKGICSCGAFKVPGVKTVWKRR
>seq2
YGLKGPDIYKGVYQFKSVEFDMSHLNLTMPNACSANNSHHYISMGTSGLELTFTNDSII
SHNFCNLTSAFNKKTFDHTLMSIVSSLHLSIRGNSNYKAVSCDFNNGITIQYNLTFSDA
QSAQSQCRTFRGRVLDMFRTAFGGKYMRSGWGWTGSDGKTTWCSQTSYQYLII
Whitespace-Separated
The whitespace-separated format is generally lists of sequences, without a description, separated by newline characters. Generally, peptide sequences are used as opposed to full-length protein sequences, but both are accepted.
Delimiter
The input box will treat any whitespace (including spaces, tabs, and newlines) as a delimiter.
Newline-separated Example:
LKCFGNTAVA
PYCNYSKFWY
TLMSIVSSLH
Space-separated Example:
LKCFGNTAVA PYCNYSKFWY TLMSIVSSLH
Named Whitespace-Separated
This format will have two columns, separated by either spaces or tabs. The first column is a sequence description/title and the second is the peptide/protein sequence.
Example:
seq1 LKCFGNTAVA
seq2 PYCNYSKFWY
seq3 TLMSIVSSLH
The sequence description (column 1) must contain only alphanumeric characters,
hyphens (-), underscores (_), or periods (.).
JSON
The NGT supports JSON files following a specific format. A JSON file should contain a list of objects with a name and sequence as a key/value pair.
Example:
[
  {
    "name":"seq1",
    "sequence":"LKCFGNTAVA"
  },
  {
    "name":"seq2",
    "sequence":"PYCNYSKFWY"
  },
  {
    "name":"seq3",
    "sequence":"TLMSIVSSLH"
  }
]
Use one of the four input formats to add sequences to the textbox.
Prediction Parameters
Default values for most parameters are pre-set in the NGT. However, the user has the option to change the parameters to suit their analysis goals. Most of the controls should be familiar with web components.
Peptide Lengths

Currently, the length is defaulted to 9. This means that any sequences that are longer than 9 will be broken into multiple 9-mers for prediction.
For example, if the sequence RQGSTPLALMDL is provided, then
this will be broken into four 9-mers: RQGSTPLAL, QGSTPLALM, GSTPLALMD, and STPLALMDL.
However, the slider can be used to select multiple lengths.

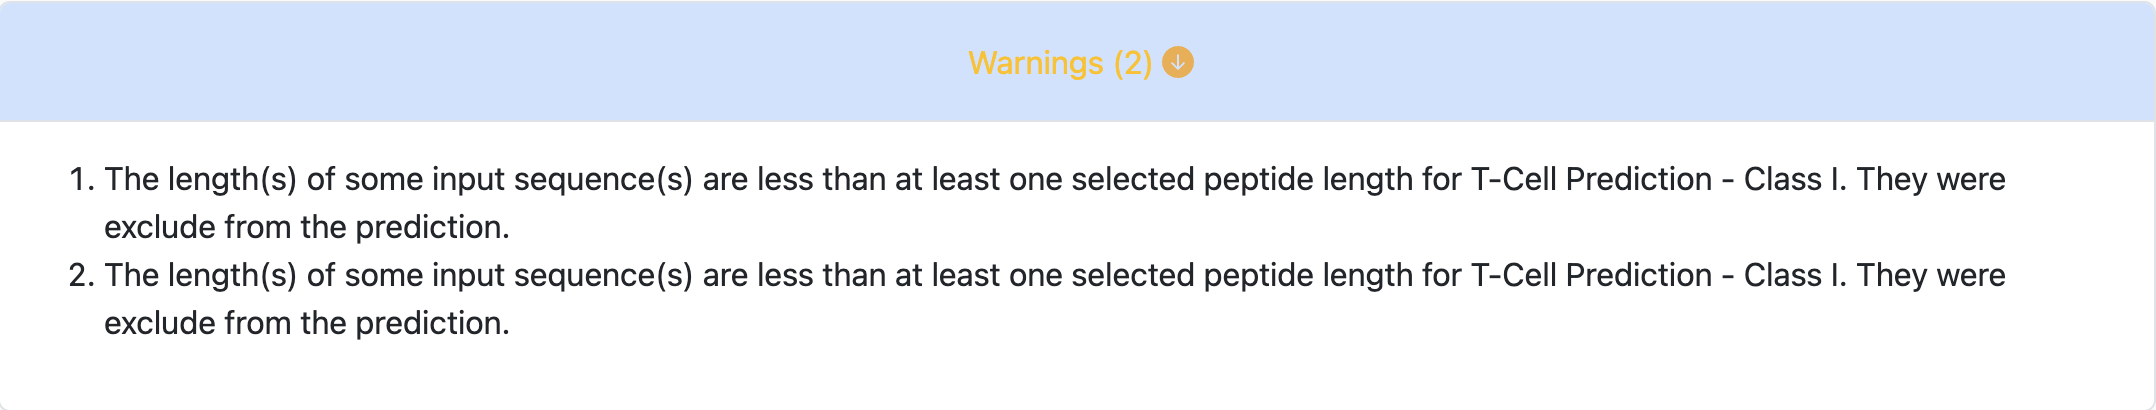
Let’s take the following 9-mer as the input sequence: RQGSTPLAL. The tool can
predict only up to the length of the peptide. Since, in this example, the peptide
length is 9, the tool can’t use length 10 or 11.
It will display the warning message once it starts running the prediction as
shown below.
Towards the right end of the slider, there is an “as-is” checkbox.
When the “as-is” is selected, the length(s) of the input sequence(s) will
be used for the prediction rather than using the values picked from the slider
(the slider will be disabled).

Peptide Length
Many of our MHC class I tools are data-driven, thus retrained and benchmarked often. The class-I binding prediction tool uses peptide length 9 as the default because it had great implications for the accuracy of binding predictions for that specific length. Other lengths are predicted using an approximation approach.
Please use this as a reference to learn more about how different lengths affect predictions.
MHC Alleles
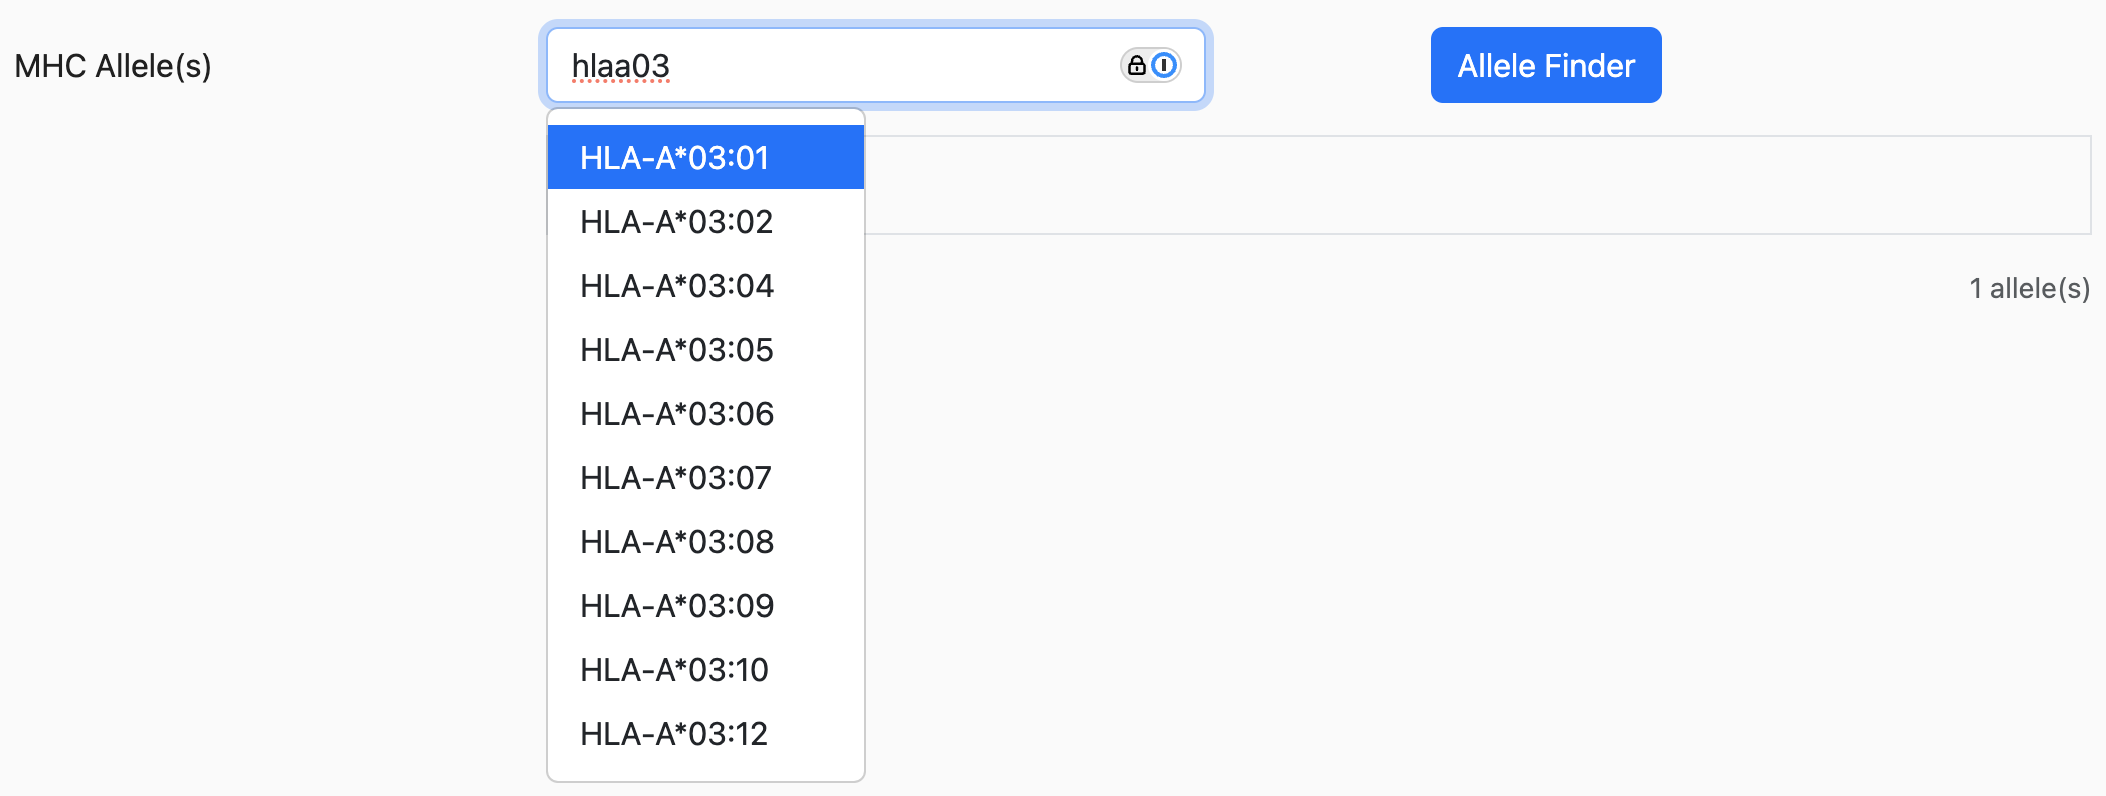
The NGT website provides an easier way to search and select alleles.
 As shown above, the first-row textbox is a search box where users can type their
desired alleles.
As shown above, the first-row textbox is a search box where users can type their
desired alleles.
Allele synonyms
For some alleles, the suggested allele might have other alleles listed on the side as the following:

The alleles listed inside the parenthesis are synonyms that all refer to the same allele. Taking the example from above, HLA-A0201, HLA-A02:01, and HLA-A*020101 are all synonyms referring to HLA-A*02:01.
Another way of viewing/searching for alleles is by using the “Allele Finder” which is located on the right side of the search box.
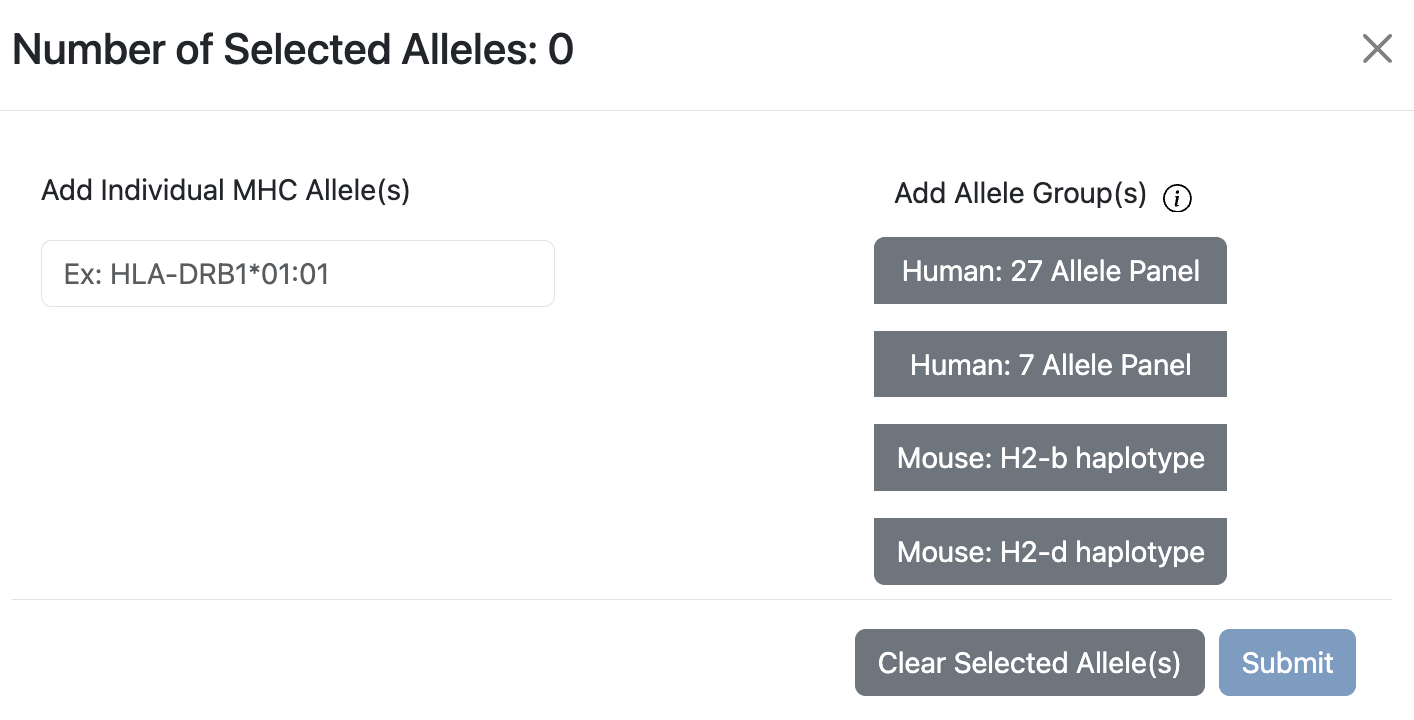
Allele Finder for Class I
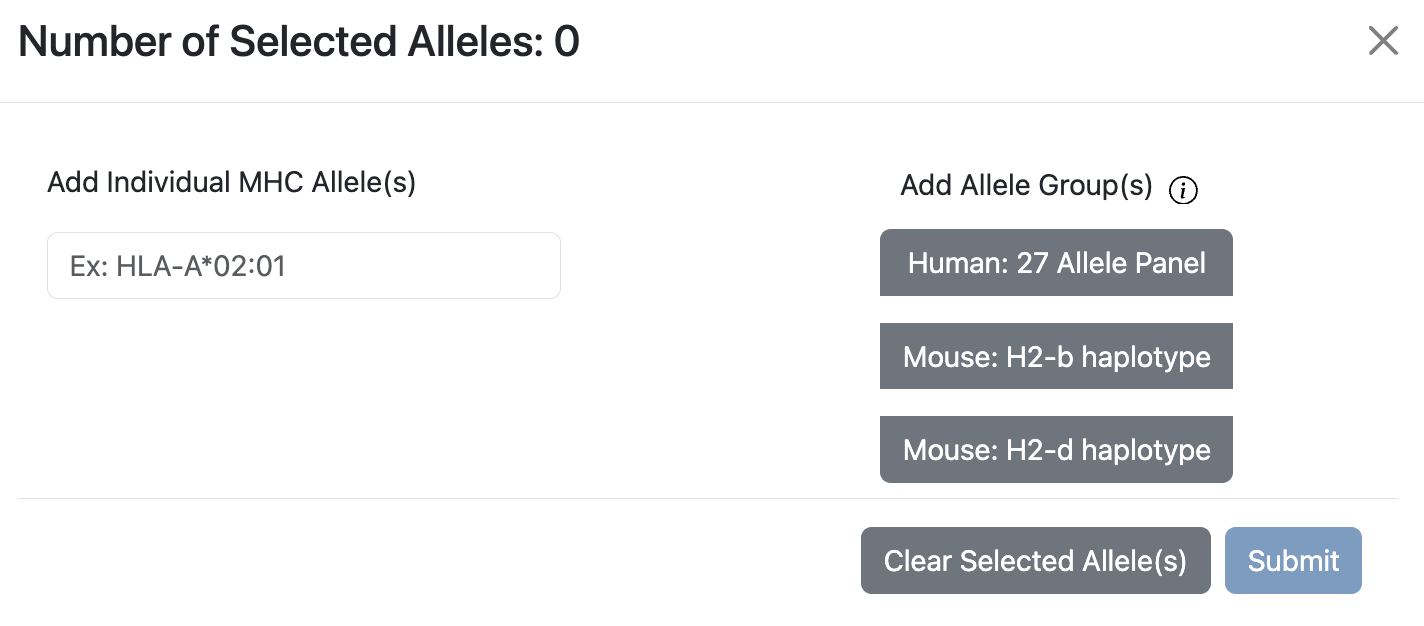
The modal will have an allele search bar on the left, and Allele Groups on the right, which contains Human 27 Allele Panel, Mouse H2-b Haplotype, and Mouse H2-d Haplotype.
To search for individual allele, use the search bar on the left to find allele.
The Human 27 Allele Panel is a set of alleles that covers ~97% of the human population.
The mouse panels have been derived from the Mouse Haplotype Table.
Mouse H2-b Haplotype for class I consists of
H2-Kb,H2-Db.Mouse H2-d Haplotype for class I consists of
H2-Kd,H2-Dd,H2-Ld.
Allele Finder for Class II
The controls are very similar to Clsss I’s Allele Finder. Only difference would be that it has an additional Human 7 Allele Panel.
Human 7 Alleles are representative HLA alleles that are common in human population and cover a broad spectrum of binding specificities. Paul et al, 2015.
Mouse H2-b Haplotype for class II consists of
H2-IAb.Mouse H2-d Haplotype for class II consists of
H2-IAd,H2-IEd.
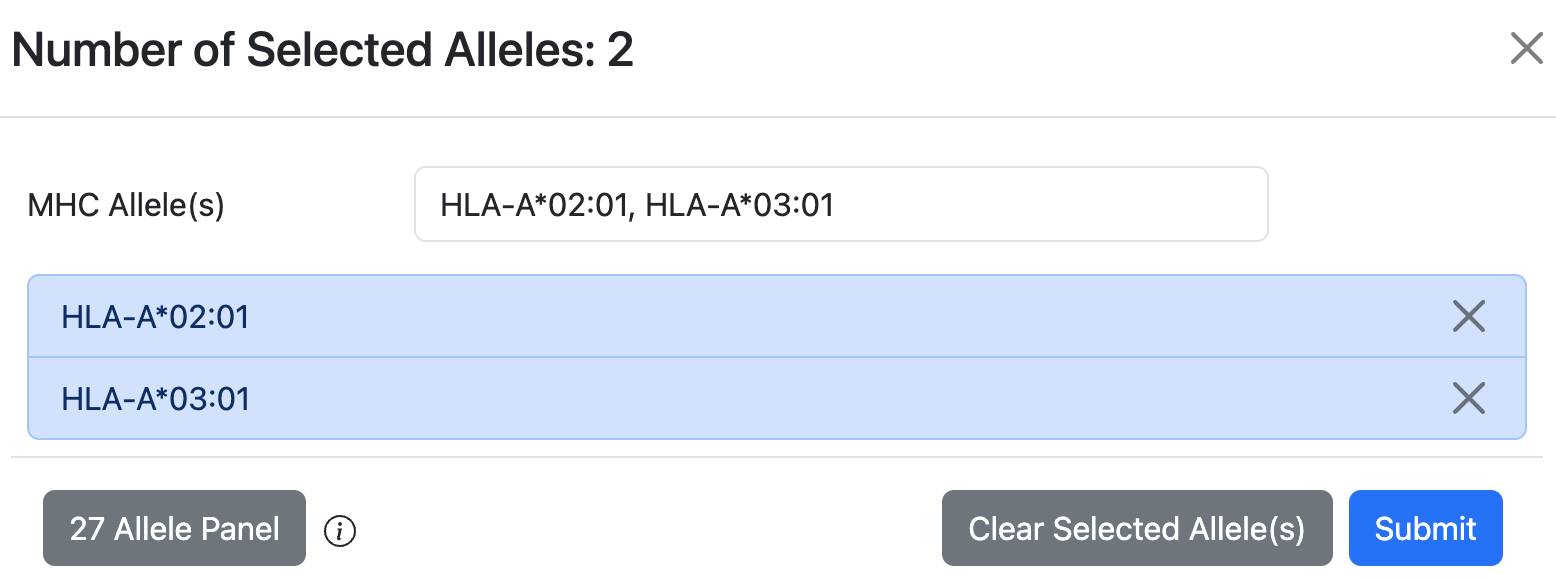
Once selected, the model will update the alleles to to the Allele Finder.
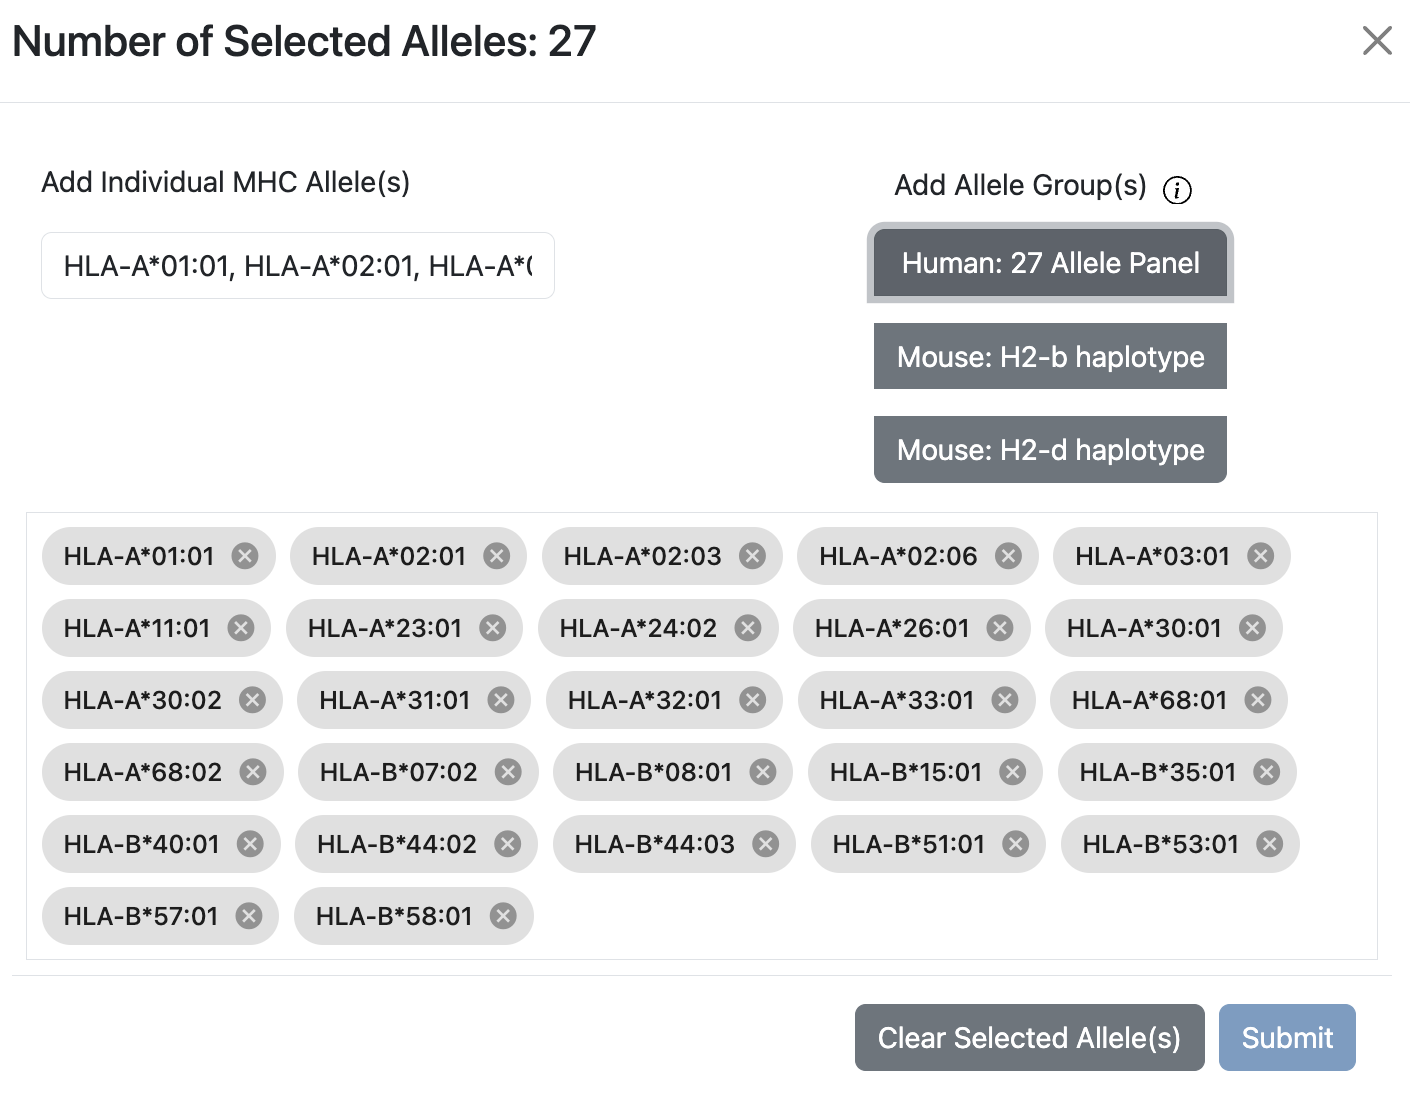
Use the Clear Selected Allele(s) button to clear the entire selected alleles.
To apply the selection back to the main page, click the Submit button, and the Allele Finder will add 27 alleles to the list.
Prediction Models
Specifically part of the T cell - class I application, a variety of different algorithms can be run against the same input dataset. These algorithms are selected in the Prediction Models section of the page. When the page is first loaded the default will be selected, which will look similar to:
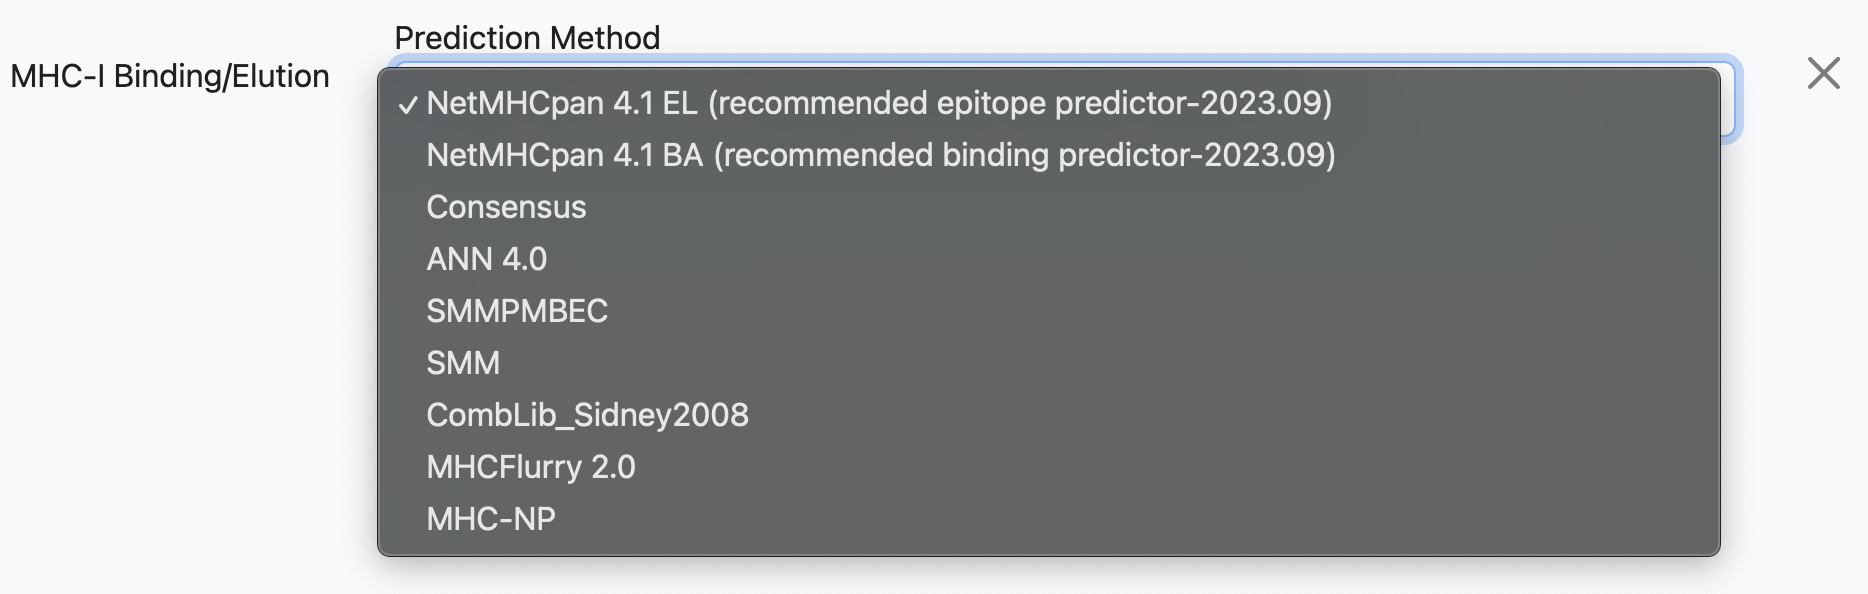
In this configuration, the tool would run an MHC-binding prediction using NetMHCPan EL 4.1 against the input dataset. However, the user may add multiple prediction models to the run, using the Add Another Prediction dropdown:
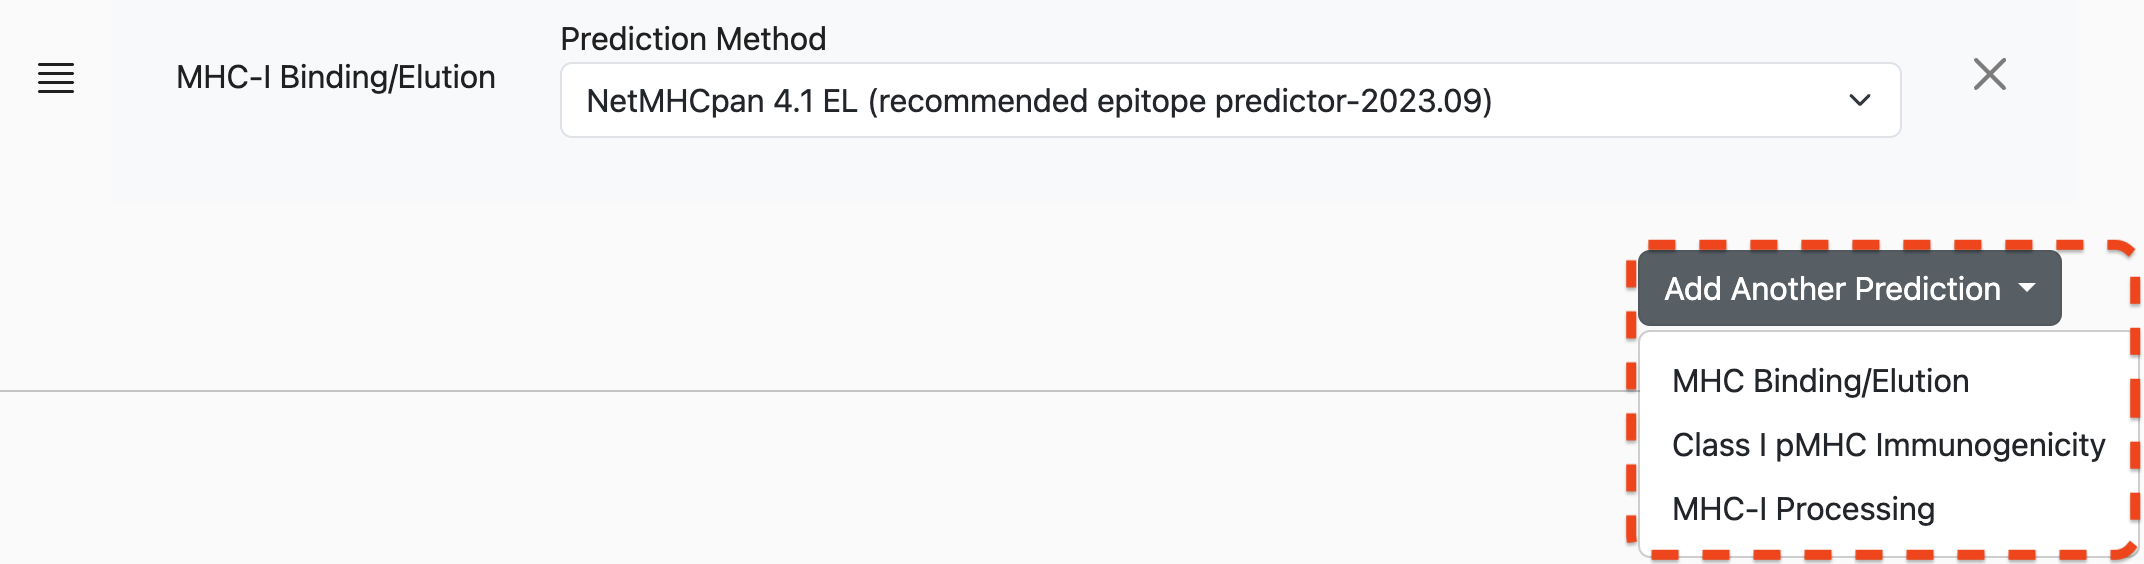
After making a selection here, e.g. MHC-I Immunogenicity, another row of controls will appear with context-specific elements. For MHC-I Immunogenicity, this is a dropdown selector for the Positions to mask:
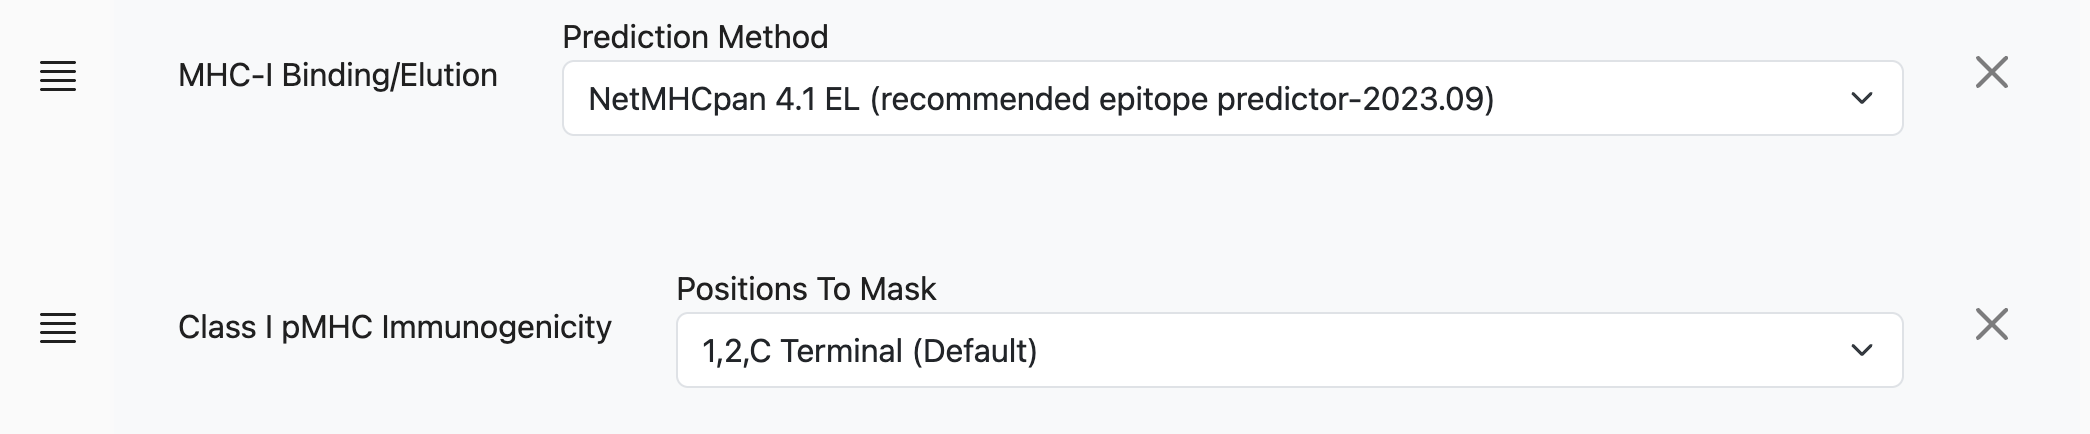
For other predictors, the controls will look different. The user can continue to add prediction models, including additional binding algorithms:
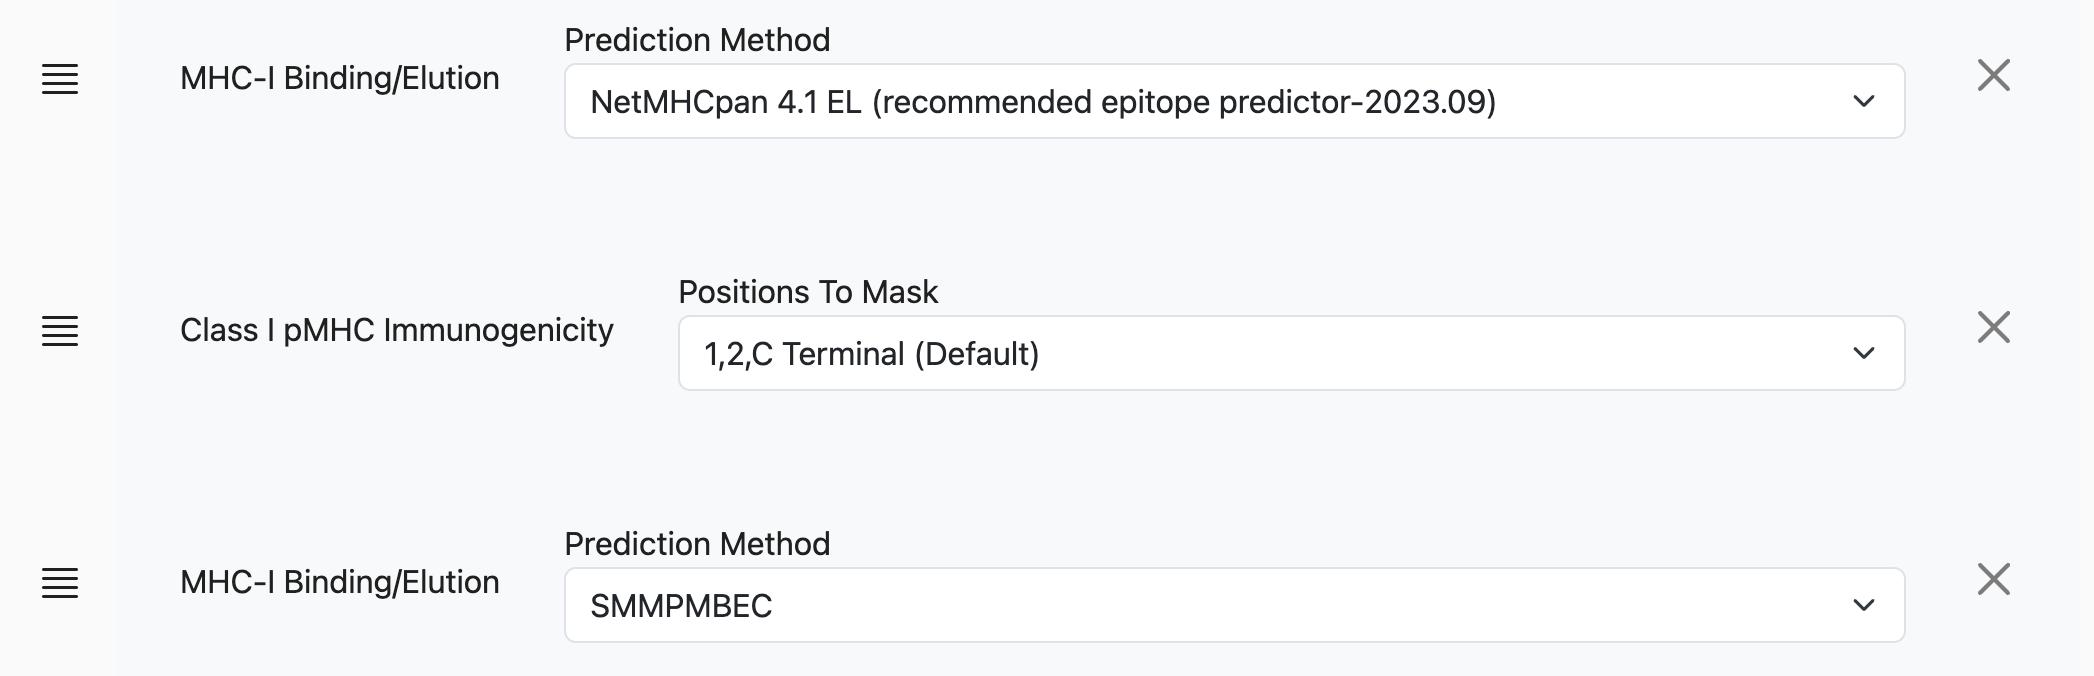
After the tool executes, results will be in tabular format with 1 row per peptide and allele and columns pertaining to each of the prediction models.
Method Ordering
Methods may be selected in any order and rearranged by clicking and dragging the “handle” on the left of each set of controls. The only effect that the ordering has is on the ordering of columns in the results table. The columns in the results table will be in the same order as specified by the prediction models.
Running a Prediction
Clicking the Run button on an application page will start the prediction with
the given inputs and parameters. Depending on the complexity of the analysis, size
of the inputs, server load, and other factors a given prediction job can take anywhere
from several seconds to hours.
Returning to an Analysis
While the system is processing your job, the blue Run button will change to
a red Cancel Run button and a loading message will appear beneath it:
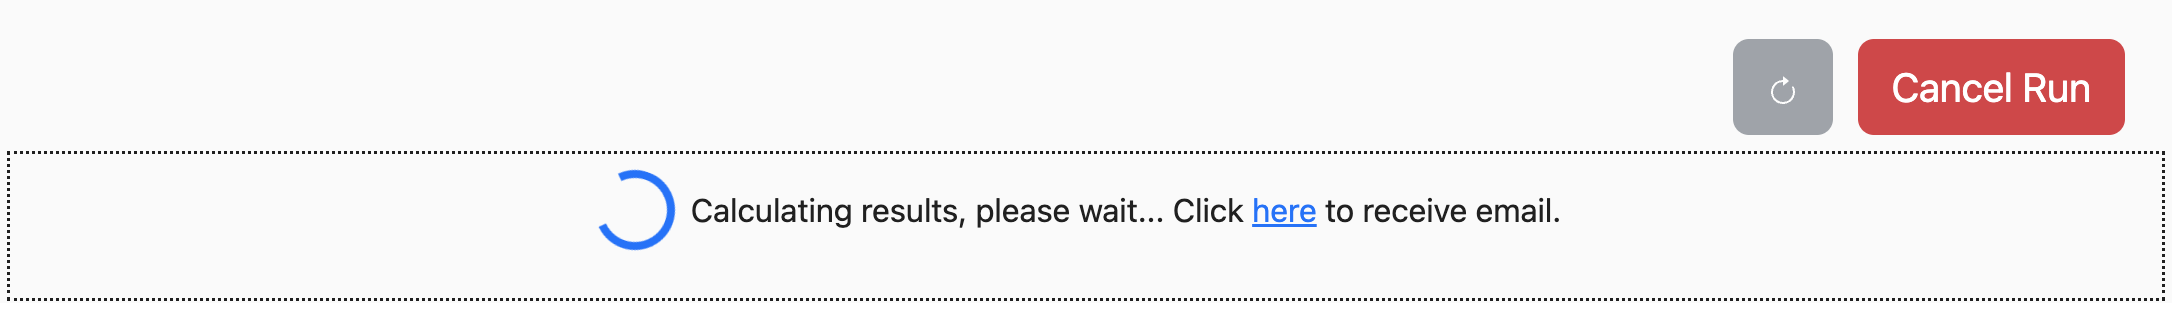
The job will continue to run even if you close your browser window.
If you would like to be notified when the job is complete, you can click on the link in the box to provide your email address. Once the job is complete, you will be sent a link back to the page.
You may also return to this page by saving the link from the browser address bar and reloading the page. Each link will contain a unique pipeline ID that will allow you to return to your analysis.
# domain name/pipeline/pipeline ID
https://nextgen-tools.iedb.org/pipeline/1b94715b-b191-44ca-b3f3-76733599d820
Warnings and Errors
Upon submission of your prediction request, the inputs and parameters are evaluated for compatibility.
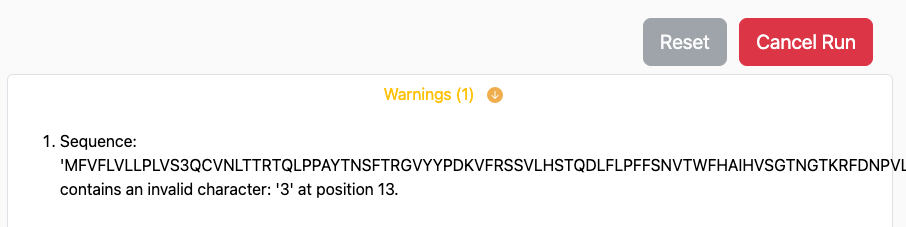
If issues are discovered that would prevent a portion of your prediction request
from running through, these would appear as warnings immediately below the
Run button:
If issues are discovered that would prevent a portion of your prediction request
from running through, these would appear as warnings immediately below the
Run button:
The portions of your prediction that are possible will continue to run on the
server. However, you may use the Cancel Job button to cancel this request
and resubmit after you address the issues with your input and parameter selection.
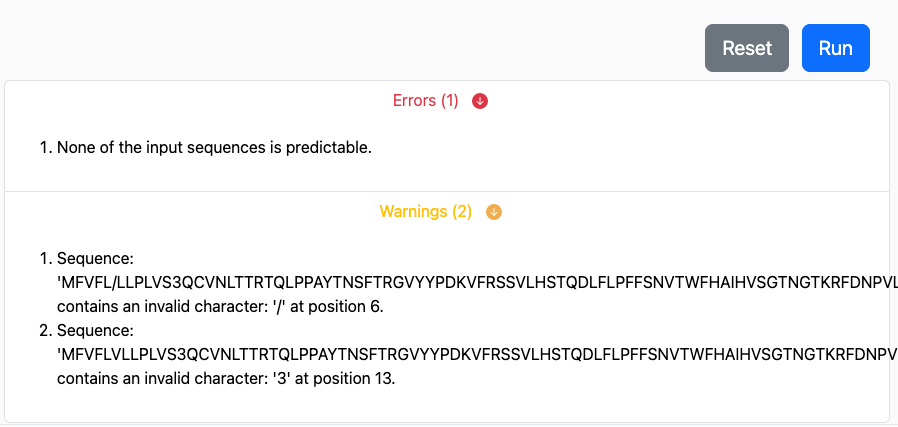
If issues are discovered that would completely prevent
the prediction from running through successfully an error is raised and
will appear immediately below the Run button, similar to:
Most warnings and errors will appear almost immediately after submission before any predictions are processed. We aim to make errors and warnings as easily understandable and actionable as possible. Let us know, by sending an email to help@iedb.org if you need assistance interpreting their meaning.
Changing Parameters After a Prediction
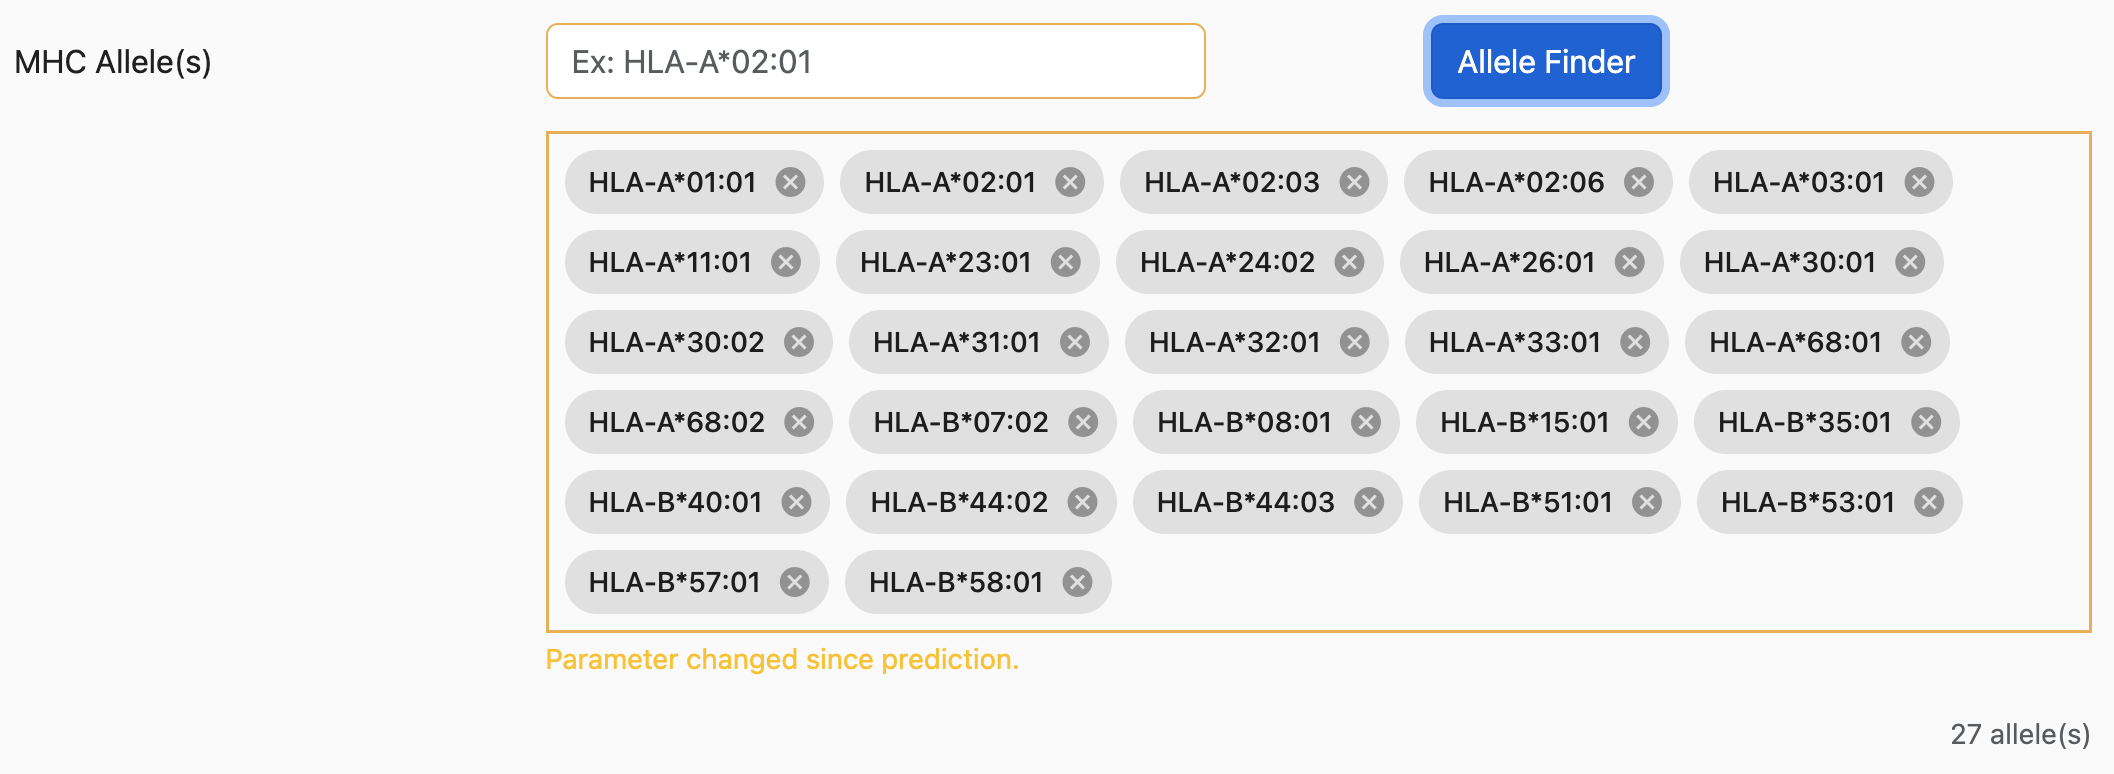
After a prediction has been submitted and results have been returned, it’s possible to change inputs and/or parameters and rerun the prediction. However, in doing so, any inputs or parameters that have changed are emphasized with a yellow border.
For example, if a prediction request is completed for HLA-A02:01 and the user now adds HLA-A*01:01, the allele input control will look similar to below:
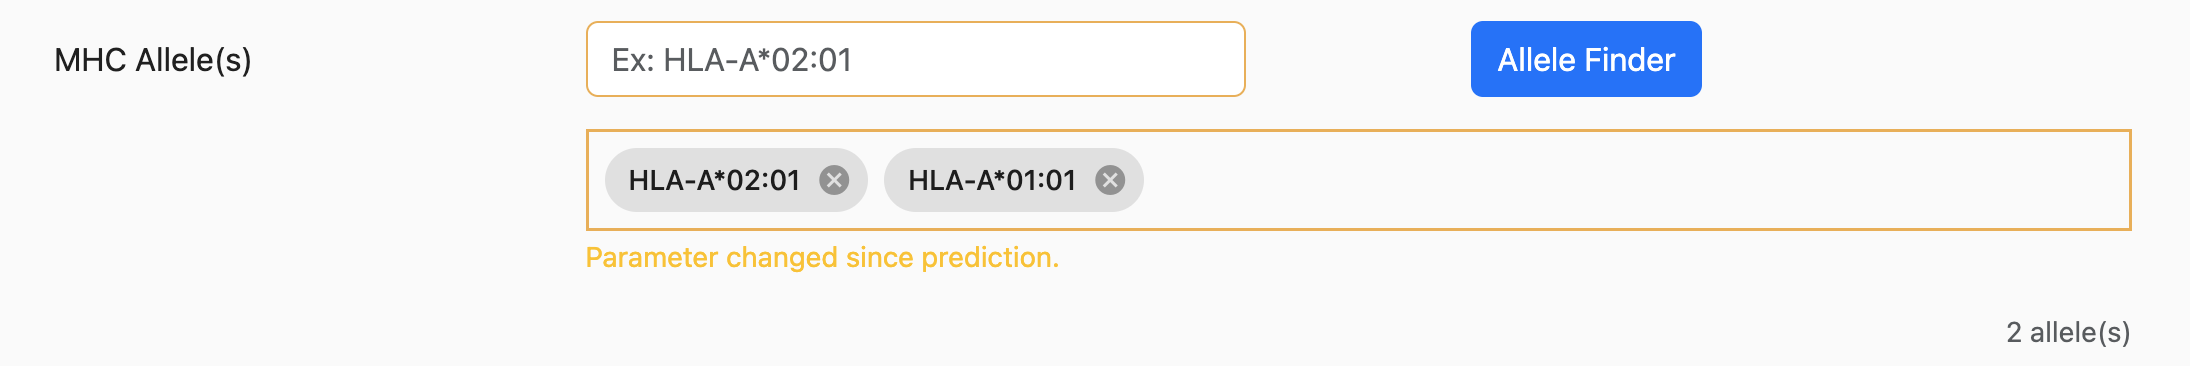
The purpose of this emphasis is to alert users that the results that are currently displayed do not match the currently selected parameters/inputs.
Tabular Results
The applications on the NGT may have several types of outputs. The most common type of output will be tabular. Result tables contain a fair amount of functionality that should allow for an elementary analysis of the output. Some of the table functionality and its controls are described in this section.
Sorting & Filtering Rows
Sorting
Tabular results returned to the user will have a default sorting order defined by the application. This can be overridden by using the controls described below.
Each table header has a set of controls for sorting (
 )
and filtering (
)
and filtering (
 ).
).
To sort a table by a specific column, click on either of the arrows.
The up arrow (
 ) will sort in an ascending* order.
The down arrow (
 ) will sort in descending order.
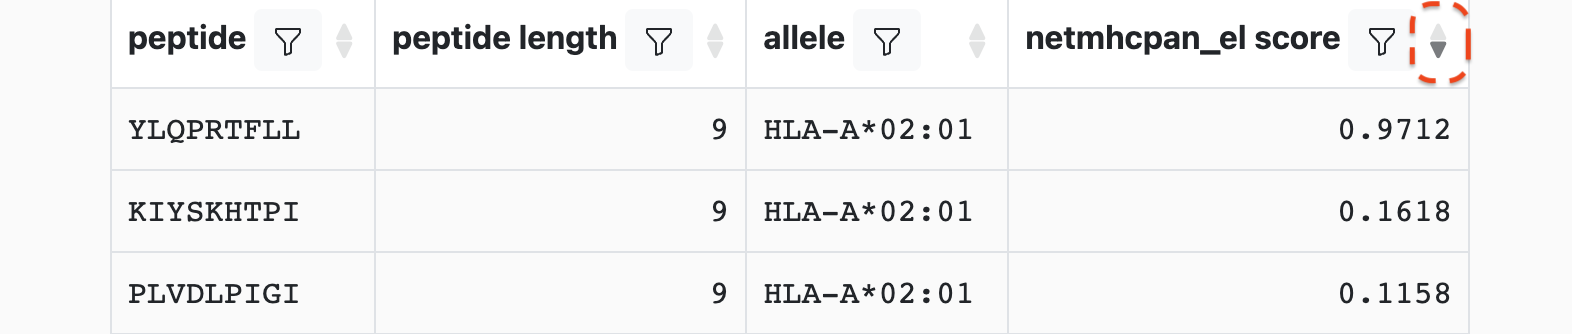
For instance, to sort on netmhcpan_el_score in descending order, the down arrow in the header would be clicked resulting in:
It is also possible to multi-sort, i.e. apply a sorting strategy based on the
values in multiple columns. To achieve this, click first on the arrow in the
column header to be used for the primary sort. Next, hold down the Shift button
on your keyboard while you click on the arrows in the additional column headers
that you would like to use for sorting.
As you do this, you will notice numbers appearing in the column headers that indicate the order of the column header in the sorting strategy. For instance, if you were to sort first by netmhcpan_el_score, next by smmpmbec_percentile, and finally by immunogenicity_score, the table header would look similar to:

The sort order can be reset back to the default by clicking on the Reset Table
(  ).
).
Filtering
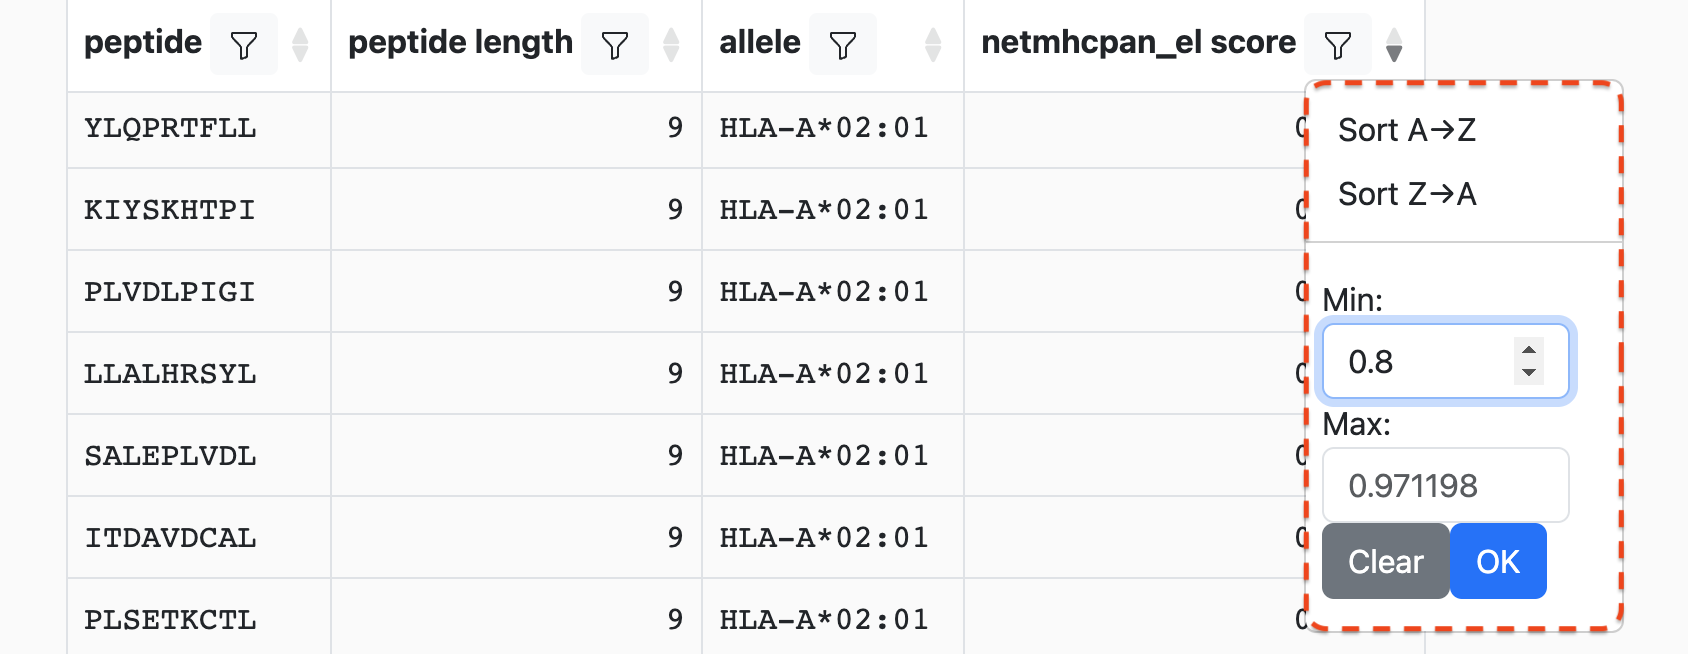
Clicking on the filter icon in a column header will bring up a menu, similar to:

Depending on the data type in the column (e.g., string, integer, etc.) the controls may look slightly different. For instance, numeric columns will allow filtering by value ranges while string columns may allow filtering on specific values.
Sticking with the example from above, we can set the minimum score to 0.8:
After we click OK, any rows with values in this column that are less than 0.8
will be removed:
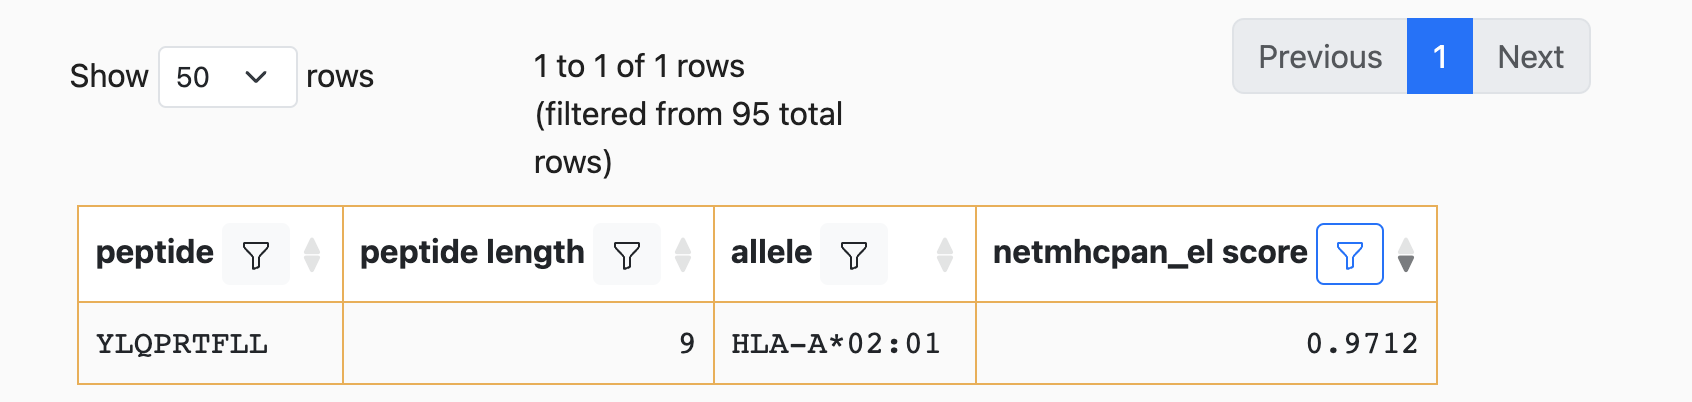
You will note that the cell borders have changed to yellow. This indicates an uncommitted state change of the table, which is described below.
Table States
The state of each analysis, including all parameters, inputs, and the state of the result tables, is tracked by the NGT servers.
Applying row filters and changing the columns that are displayed are the two ways that the state of a table can change.
Unless this state change is communicated back to the NGT servers, the next time the user loads the analysis from the URL in the address bar the changes to the table will be lost.
As a visual cue to the user, these “uncommitted” state changes are emphasized
with yellow borders around each cell of the table. To “commit” these
changes, click on the Save Table State button at the top of the table:
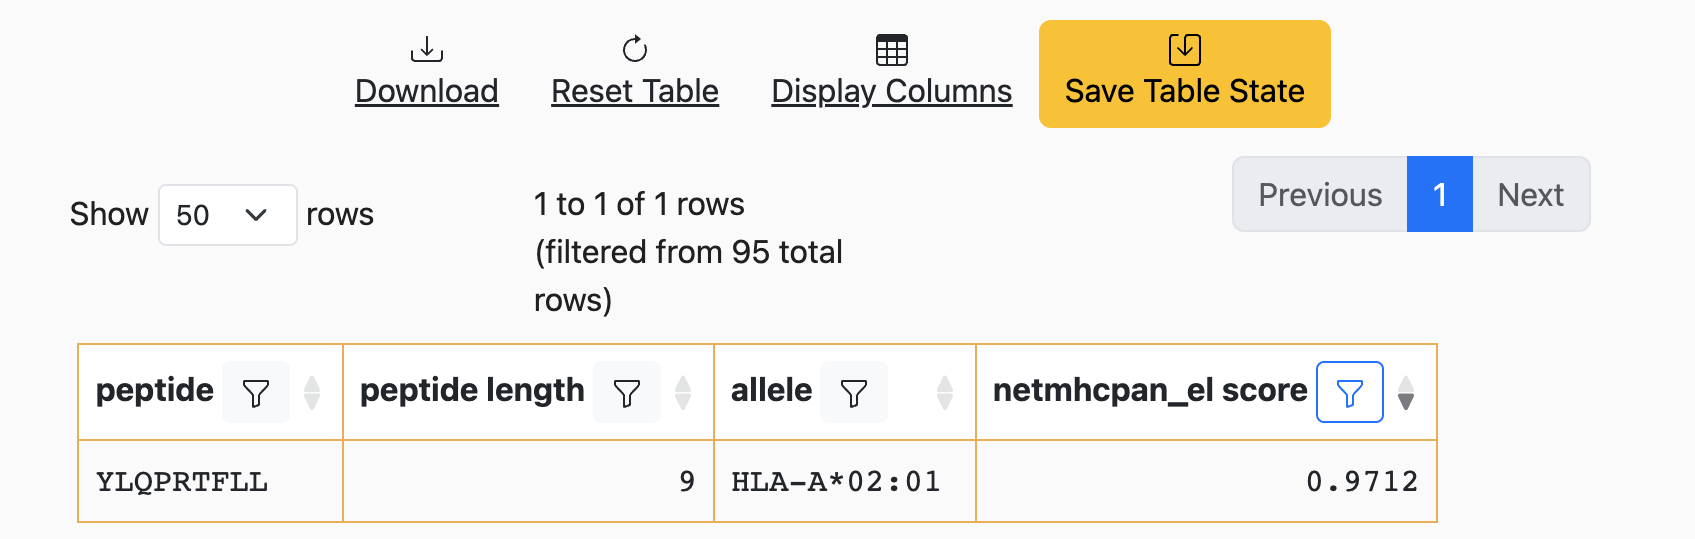
Once this button is clicked, the borders will return to their original color. More importantly, the next time the URL is loaded, the current filters will be applied to the table.
Show/Hide Columns
Some predictor selections can result in a large number of columns being returned to the user. Most are displayed, but several are kept hidden by default.
To change the columns that are displayed, click on the Display Columns button
at the top of the table:
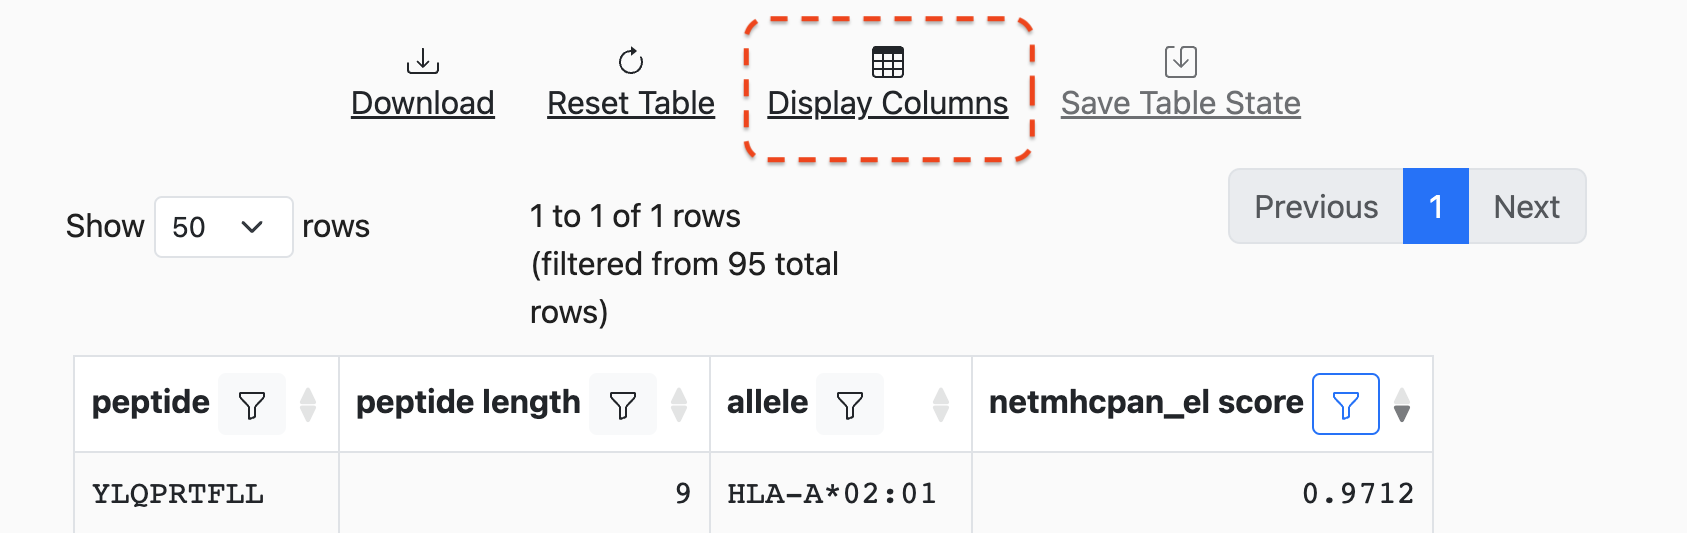
This will bring up a modal that will list all available columns and allow for the selection/deselection of what is currently displayed:
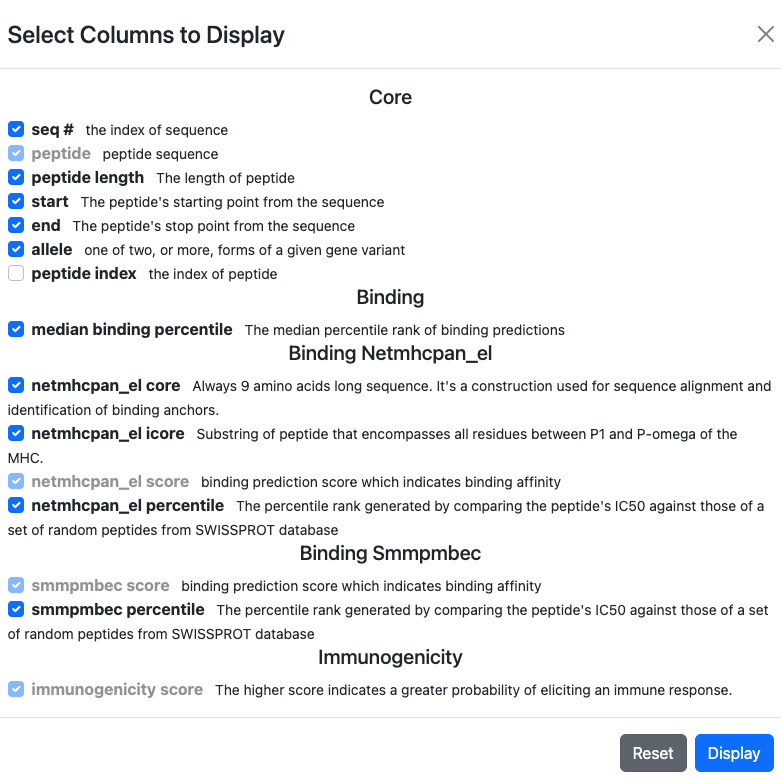
After selecting which columns to show on the result table, make sure to click on
Display button on the bottom right corner to actually update the result table.
In addition to the name of each column, a brief description of its contents can also be found.
Select/Deselect Columns
Columns that are used for the currently active sort or filter cannot be deselected for display.
Click on
Displaybutton for the result table to actually reflect the update.
To reset the display to the initial defaults, click on the Default button.
Downloads
Results can be downloaded in TSV, CSV, and JSON formats by clicking
on the Download button at the top of the table. A menu will appear that will
allow for the selection of All Rows versus Displayed Rows:
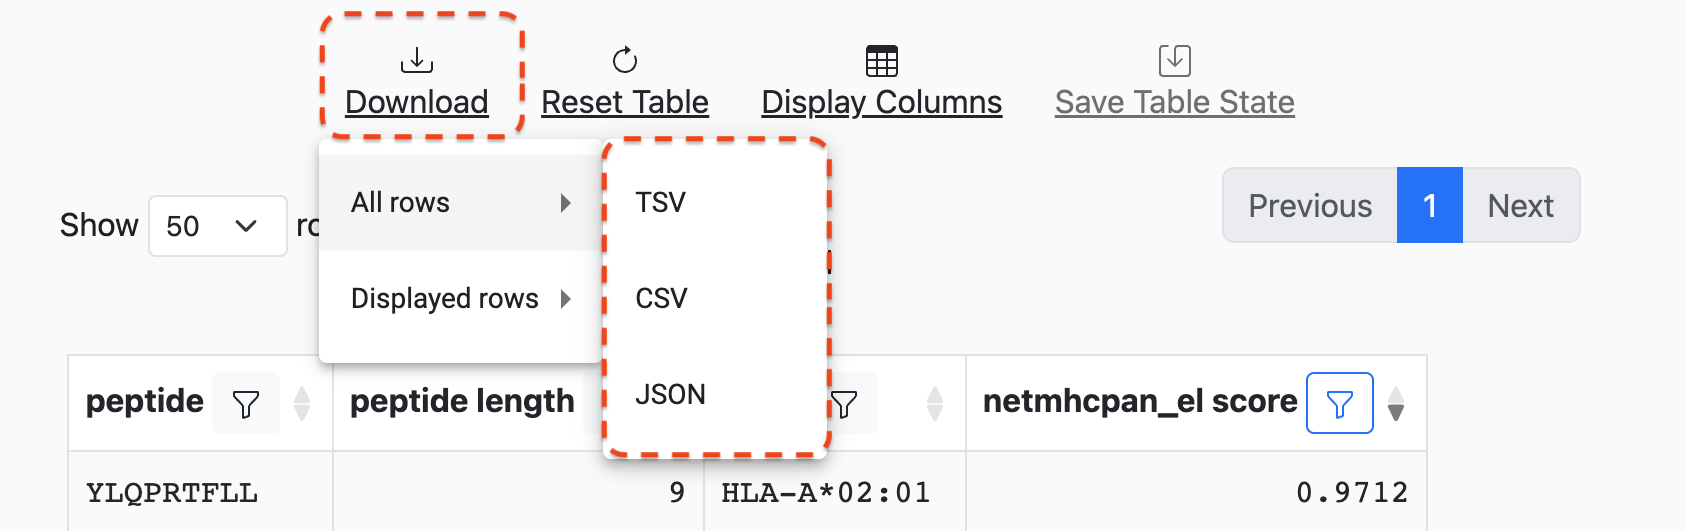
Selecting Displayed Rows will download the data after filters are applied.