Pipelines
A pipeline is a set of unique tools that can be run sequentially by using the result of one tool as input to the next tool. This allows for seamless integration between different tools within the NG Tools application. Pipelines can be saved so that they can be shared and re-used with collaborators.
Building a Pipeline
Pipelines are built in a step-by-step fashion. Once the tools and parameters are selected to your liking, the pipeline may be run on many different input datasets. It is recommended to build a pipeline up with a small subset of your dataset before scrolling back to the top and entering your full dataset.
Valid Steps
There is a limited set of fields from any given step that may be used as inputs for downstream steps. The full list of valid next steps is always available at the valid_steps API endpoint.
In order to build a pipeline:
Configure and run tool 1. Using a small input dataset, adjust the parameters for the initial tool accordingly and click
Run.Apply filters (optional). Using the controls in the Results table header, filter for the rows that you would like to send to the next tool. See the section on Passing Filtered Results To Downstream Tool below.
Select the next tool. When tool 1 results appear, the
+button also appears in the Pipeline Map (sidebar). The+button is a dropdown that contains a list of tools that can use the results from tool 1 as inputs to tool 2.Select the column that will be sent. The tool dropdown mentioned above contains submenus that list the columns that can be sent to the next tool. Make the appropriate selection.
Repeat until complete. Repeat steps 1 through 4 until the steps of the pipeline are defined to your need.
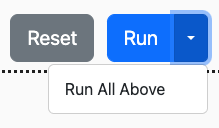
Run!. Click
Runfor each step,Run All Abovefrom theRundropdown on one of the downstream steps.
Note
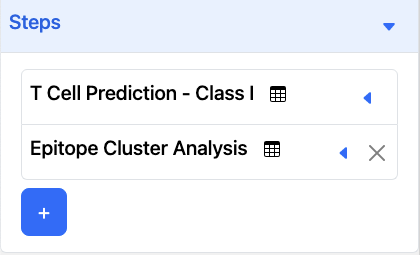
Only the most recently added tool can be removed from the pipeline using the x button next to the name of the last under Steps.
Passing Filtered Results to Downstream Tool
After a table column is filtered, the result table is highlighted in yellow and the
Save Table Statebutton is enabled.Click on the ‘Save Table State’. The table will un-highlight, the
Save Table Statebutton becomes disabled, and the filtered columns are now saved to the pipeline.Only the data that was last saved by ‘Save Table State’ will be passed down to the downstream tool.
To pass all data downstream, clear all filters and click on ‘Save Table State’. Then select and run the next tool.
Pipeline Map
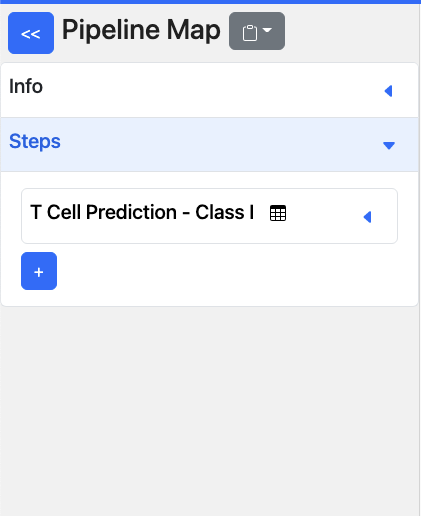
The pipeline map is a sidebar feature that is used to build and visualize pipelines. It also allows for the sharing of complete pipelines, both with and without data for reproducibility. This is explained in Saving/Sharing Pipelines
<<button - Minimizes the pipeline map dropdown that contains
 pipeline_idandpipeline_spec_idurls explained in Saving/Sharing Pipelines.Info - Contains inputs for
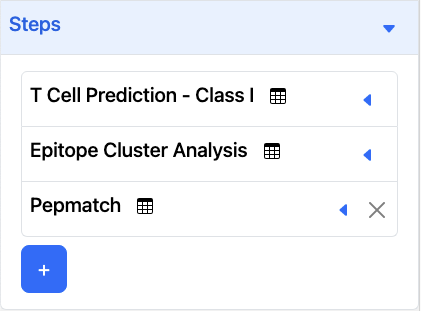
Pipeline NameandEmailSteps
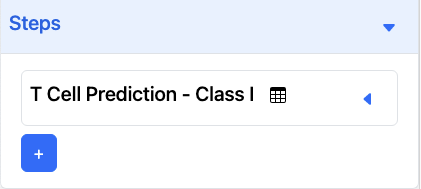
Each step of the pipeline is listed here, with the name of the tool (e.g., T Cell Prediction - Class I).
Tool Parameters - Expanding the step, by clicking on the
 will reveal the current input values for the selected tool.
+button - Add a new tool to the pipeline. The output of the previous tool, in this case T Cell Prediction - Class I, will be used as the input for the next tool.Icons
 Running tool and waiting for results.
 Results are displayed.
 Filters are applied to the result.
Saving/Sharing Pipelines
After a tool runs in the pipeline, the pipeline is saved in the database and can be retrieved using the ‘Link to this pipeline’ (pipeline_id) or ‘Link to pipeline configuration’ (pipeline_spec_id).
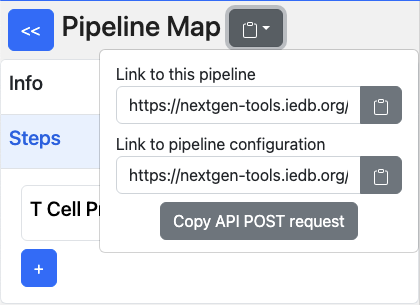
Pipeline Steps with Data (pipeline_id)
https://nextgen-tools.iedb.org/pipeline/{pipeline_id}

EX:
https://nextgen-tools.iedb.org/pipeline/6501c8cc-c362-4f98-ae64-a170fd3d3aae
The pipeline url contains pipeline_id which is used to retrieve the tools, parameter selections, input data, and results for the pipeline.
Pipeline Steps without Data (pipeline_spec_id)
https://nextgen-tools.iedb.org/pipeline_spec/{pipeline_spec_id}

EX:
https://nextgen-tools.iedb.org/pipeline_spec/ce0b8758-2b5e-4ae1-a340-bef63c30e533
The pipeline spec url contains pipeline_spec_id which is used to retrieve only the tools and parameter selections for the pipeline.
No input sequences or results are stored with pipeline_spec.
Note
Anyone with the link to the specific pipeline or pipeline_spec may retrieve the results without authentication. Pipelines with and without data are currently stored indefinitely on the NG Tools system. In an upcoming release, a more formal retention policy will be established.
Notes on the Pipeline Lifecycle
Run
When the
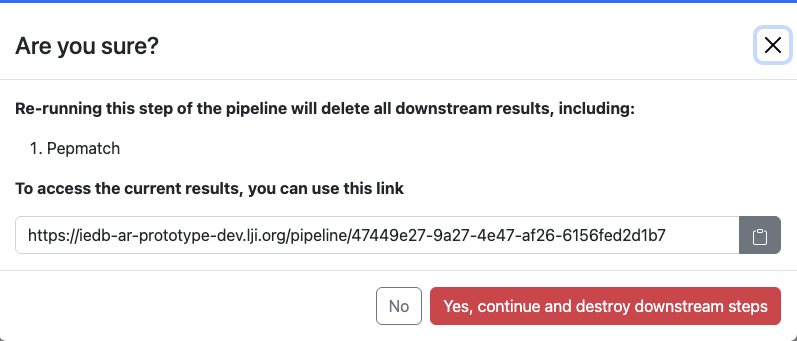
Runbutton is clicked in a step that has previously been run, downstream results are deleted from the page, after a popup confirmation. In the popup, you will be given the URL where you can recover the previous results if needed.
Run All Above
This selection is available from the
Runbuttons of downstream steps. It will run all the steps up to and including the step whereRun All Abovewas clicked.
Cancel
The
Runbutton morphs into aCancelbutton while a step is running Clicking here will cancel the current execution.
A pipeline ID is created and saved whenever a tool is run via Run or Run All, and when the table state is saved via Save Table State.
As downstream steps are dependent upon their input from upstream steps, results from downstream steps will disappear when an upstream step is rerun. A verification modal shows up before this occurs:
Example Pipelines
One-Step Pipeline
To start a pipeline, please select a tool from the home page or on the ‘Tools’ dropdown at the top right.
In this example, the 1-Step Pipeline is T Cell Prediction - Class I.
Set parameters and click ‘Run’ to get results.
Two-Step Pipeline
To add a 2nd tool to the pipeline, click on the + button and a dropdown will appear.
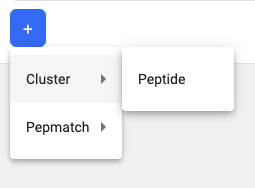
In this example, the 2-step pipeline is T Cell Prediction - Class I and Cluster. Because ‘Peptide’ is the only option in this example, the ‘Peptide’ column for T Cell Prediction results will be passed as input sequences to Cluster.
Set parameters and click ‘Run’ to get results.
Three-Step Pipeline
To add a 3rd tool to the pipeline, click on the + button and the dropdown will appear. All tools that are already part of the pipeline cannot be selected again (i.e. T Cell Prediction - Class I).
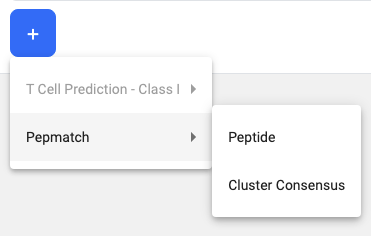
In this example, the 3-Step pipeline is T Cell Prediction - Class I, Cluster, and Pepmatch. ‘Peptide’ and ‘Cluster Consensus’ are both columns that can be passed as input sequences to Pepmatch.
Set parameters and click ‘Run’ to get results.