T cell class II
The T cell class II tool combines MHC class II binding and CD4 T cell immunogenicity tools into one application. This allows users to easily run the individual predictors on the same input dataset and compile the results into one table. Below, we describe all of the available methods.
Binding Predictions
Method
The tools in this group take amino acid sequences and MHC alleles as input to predict the strength of the peptide: MHC interaction. Depending upon the tool selected, the main output will be a predicted IC50 value (lower indicates stronger predicted binding) or a score. To make comparisons between alleles and methods more straightforward, a percentile rank score is also returned where lower always indicates stronger binding or higher probability of elution (depending upon the predictor). The percentile rank is the fraction of peptides drawn randomly from UniProt that would elicit predicted affinity/score as strong as or better than the current peptide.
Available binding and elution predictors
The methods below can be classified as ‘binding’ or ‘epitope’ predictors based upon the datasets upon which they were trained and the outputs they produce.
Binding predictors (denoted with [B]) predict the strength of the peptide: MHC interaction, regardless of whether the peptide can be naturally processed and presented
Epitope predictors (denoted with [E]) are trained on eluted ligand data and thus inherently take into account the natural antigen processing pathways, in addition to the strength of the peptide: MHC interaction
[B/E] NetMHCIIpan
NetMHCIIpan uses Artificial Neural Networks (ANNs) to predict peptide binding to any MHC II molecule of known sequence or elution from the cell surface, depending upon which mode is employed. The various versions of the tool differ in the underlying datasets upon which they were trained and the information used to make their predictions.
NetMHCIIpan can be run in two different modes:
EL - Eluted ligand mode predicts the likelihood of a peptide being eluted from the cell surface after natural processing
BA - Binding affinity mode predicts the strength of the peptide:MHC interaction
Several versions of NetMHCIIpan are available on the NG tools site:
NetMHCIIpan 4.1 (IEDB recommended epitope & binding predictors 2023.09)
This method was trained on a of over 500,000 measurements of Binding Affinity (BA) and Eluted Ligand mass spectrometry (EL), covering the three human MHC class II isotypes HLA-DR, HLA-DQ, HLA-DP, as well as the mouse molecules (H-2) – EL data covering 74 molecules.
[PMID: 35154160]
NetMHCIIpan 4.2
This was trained on a dataset of over 600.000 measurements of Binding Affinity (BA) and Eluted Ligand mass spectrometry (EL), covering the three human MHC class II isotypes HLA-DR, HLA-DQ, HLA-DP, as well as mouse molecules (H-2). The method is trained on a extended set of HLA-DQ EL data as compared to NetMHCIIpan-4.1.
[PMID: 37085710]
NetMHCIIpan EL 4.3
This method was trained on a dataset of over 650,000 measurements of Binding Affinity (BA) and Eluted Ligand mass spectrometry (EL), covering the three human MHC class II isotypes HLA-DR, HLA-DQ, HLA-DP, as well as mouse (H-2) and bovine (BoLA-DRB3) molecules. The extended EL dataset includes new data for HLA-DP, HLA-DR and BoLA-DRB3.
[PMID: 38000035]
[B] Consensus 2.22
The consensus method was developed by the IEDB team by combining features from SMM-align, Sturniolo, and Combinatorial Library methods. With the introduction of NN-align, the method was updated to incorporate NN-align, SMM-align, and the combinatorial peptide scanning library. When the scanning library is unavailable for a specific allele, the Sturniolo method is used as a substitute. The original version of this method is described in a paper by Wang et al. (PLoS Comput Biol, 2008).
[PMID: 18389056]
[B] NN-align (NetMHCII) 2.3
The NN-align is an artificial neural network-based alignment algorithm designed for MHC class II peptide binding prediction. It simultaneously identifies the MHC class II binding core and predicts binding affinity. The method is trained using an algorithm that corrects bias in the training data caused by redundancy in the binding core representation. Prediction accuracy is significantly improved when information about the residues flanking the peptide-binding core is incorporated. A detailed description of the method can be found in the 2009 paper by Nielsen and Lund (BMC Bioinformatics, 2009).
[PMID: 19765293]
[B] SMM-align (NetMHCII) 1.1
The MHC class II binding groove is open at both ends, making the correct alignment of a peptide within the groove essential for identifying the core binding motif. The Stabilization Matrix Alignment (SMM-align) method enables direct prediction of peptide:MHC binding affinities by incorporating amino-terminal peptide flanking residues (PFR). By favoring binding registers with a minimum PFR length of two amino acids, SMM-align achieves a consistent improvement in predictive performance. This method provides quantitative peptide:MHC binding affinity values and has been trained and evaluated on a dataset covering the nine HLA-DR supertypes and three mouse H2-IA alleles. It is described in detail by Nielsen et al. (BMC Bioinformatics, 2007).
[PMID: 17608956]
[B] Combinatorial Library
The positional scanning combinatorial libraries approach utilized a pool of random peptide libraries to systematically measure the contribution to MHC binding from each amino acid at each of the nine positions at the binding peptide. Each pool in the library contains 9-mer peptides with one fixed residue at a single position. With each of the 20 naturally occurring residues represented at each position along the 9-mer backbone, the entire library consisted of 180 peptide mixtures. Competitive binding assays were then carried out to determine the IC50 values for each pool. IC50 values for each mixture were standardized as a ratio to the geometric mean IC50 value of the entire set of 180 mixtures, and then normalized at each position so that the value associated with the optimal value at each position corresponds to 1. For each position, an average (geometric) relative binding affinity (ARB) was calculated, and then the ratio of the ARB for the entire library to the ARB for each position was derived. The final results are a set of 9 by 20 scoring matrices which could predict the binding of novel peptides to MHC molecules. It is described in Wang et al. (BMC Bioinformatics, 2010).
The methodology is the same as that used for the MHC class I combinatorial library tool as described in Sidney et al. Immunome Res. 2008.
[PMID: 21092157]
[B] Tepitope (Sturniolo) 1.0
This matrix-based approach is used in the TEPITOPE class II epitope prediction program. It is described in Sturniolo et al. (Nat. Biotechnol., 1999).
[PMID: 10385319]
Input Data
Enter amino acid sequences in the Input Sequence box using the formats described in Getting Started — Input Sequence Formats. Set peptide length (11–30) and shift length to tile the sequence, and choose MHC class II allele(s).
Parameter Selection
By default, a peptide length of 15 and the HLA-DRB*01:01 allele are selected. However, by using the peptide length slider and MHC Allele autocomplete, many combinations of peptide lengths and alleles may be submitted simultaneously. Note that additional lengths and alleles will result in predictions taking longer.
Peptide Length
Peptide length can be selected using the slider, which ranges from 11 to 30. Upon submission, protein sequences in the Input Sequence box will be broken up into overlapping peptides of the selected lengths.
Peptide Shift Length
Refers to the number of amino acids that are skipped, or not included, when dividing a sequence into peptides. Essentially, it determines the step size of the sliding window used to generate peptide fragments (The default value is 5).
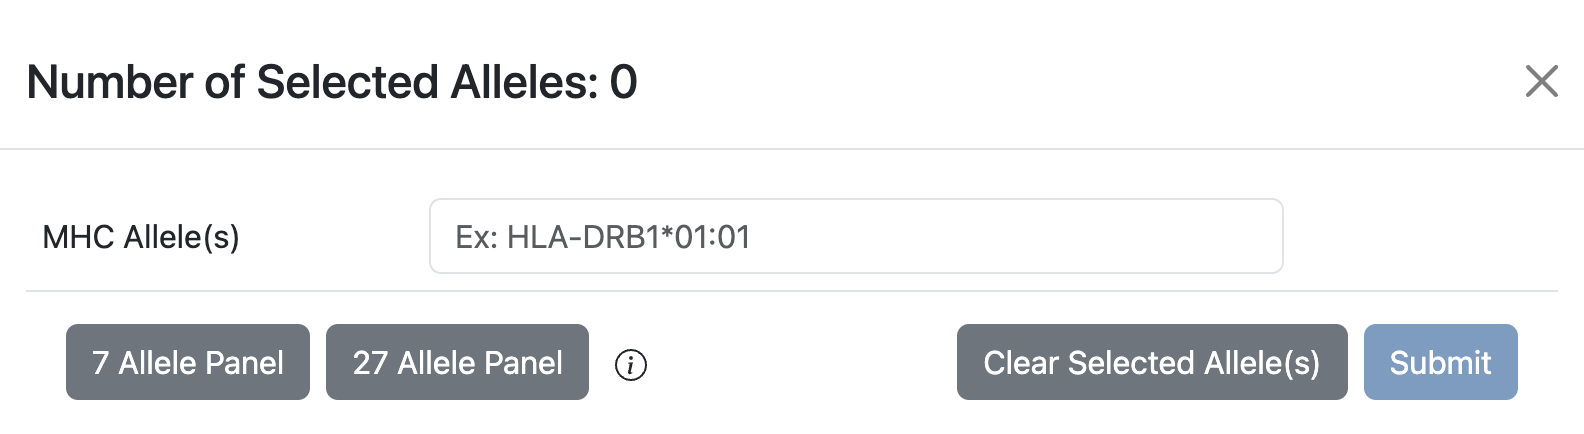
MHC Allele(s)
Typing into the MHC Allele text box will autocomplete based on official allele names and synonyms from the MHC Restriction Ontology (MRO). As alleles are selected, they will appear as ‘chips’ in the box immediately below. Alleles can be deselected by clicking on the ‘x’ inside the chips.
The Allele Finder provides some additional controls, including selecting the HLA allele reference panel of 27 alleles and 7 alleles as shown below.
Results
Thresholds and interpreting scores
The IEDB currently recommends using the percentile rank as the metric for ranking binding and elution predictions, although there are many sensible approaches. Alternate approaches for selecting binders can be utilized depending on a user’s needs. For more information on selecting thresholds, please consult these guidelines.
Once the prediction is completed, an output table will be displayed similar to the one shown below.
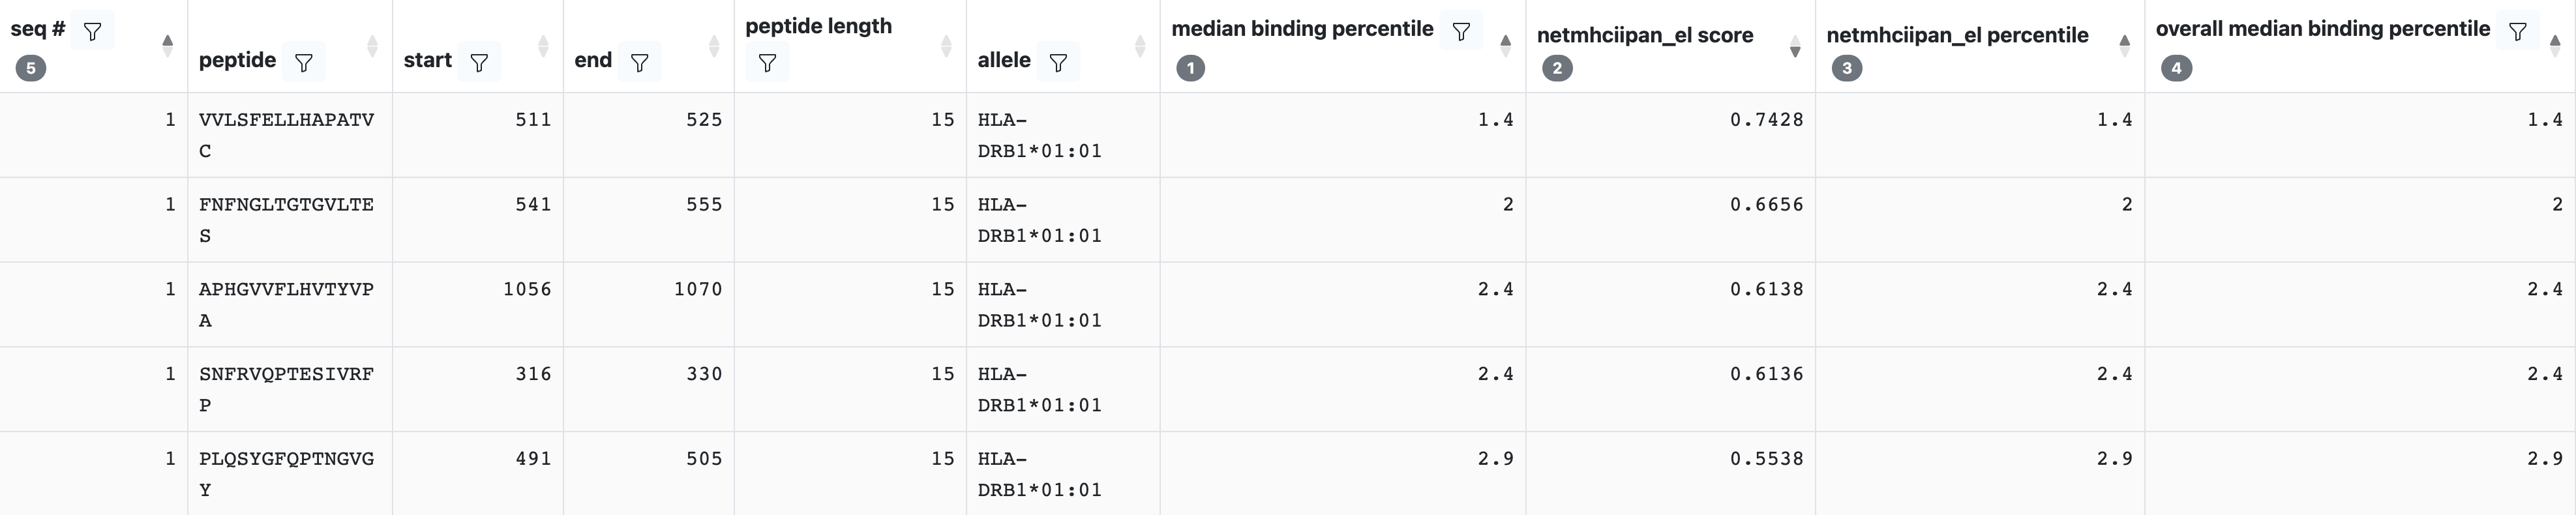
Each row in this table corresponds to one peptide and allele combination. Several columns will always be present, including the seq #, peptide, peptide length, start, end, and allele. Any additional columns returned will depend upon the binding methods that were selected. A description of each field can be found by clicking on the ‘Display Columns’ button.
The predicted output is given in units of IC50nM for Combinatorial library and SMM-align. Therefore a lower number indicates higher affinity.
As a rough guideline,
Peptides with IC50 values < 50 nM are considered high affinity
Peptides with IC50 values < 500 nM intermediate affinity
Peptides with IC50 values < 5000 nM low affinity.
Note
Most known epitopes have high or intermediate affinity. Some epitopes have low affinity, but no known T-cell epitope has an IC50 value greater than 5000.
Individual Predictor Notes
Here we outline the idiosyncrasies of individual methods.
Consensus method
Several additional columns are included when the consensus method is used:
The consenus percentile - similar to the median binding percentile that is included for all predictions, the consensus percentile rank is the median percentile rank for the predictors included in the consensus method (SMM align, NN align, Comblib, Sturniolo/Tepitope). If predictors other than those included in the consensus method are used, the median and consensus percentile ranks will differ.
The consensus adjusted percentile is analogous to the consensus percentile, but calculated against the individual method ‘adjusted percentiles’ rather than raw percentiles.
Tepitope / Sturniolo
The prediction result for Tepitope (Sturniolo) is given as raw score. Higher score indicates higher affinity.
Percentile rank dataset
To establish percentile ranks, the complete “Reviewed (Swiss-Prot)” dataset was downloaded on 10/29/2018. The file contained 558,712 sequences. After filtering for length (minimum 50aa) and predictability (valid amino acids), 544,147 sequences remained. Of those, 10,000 were selected at random as a source of peptides. One peptide of each length (from 8-15) from a random location in each of these protein sequences was drawn to serve as the final background dataset, which is made available here.
Immunogenicity Predictions
Method
The tool is developed to predict the allele independent CD4 T cell immunogenicity of a peptide (MHC (pMHC) complex) at population level.
Note
Output from the re-implementation of CD4Episcore on the the Next-Generation Tools website is not backwards compatible with that of the Legacy site. This is because the Legacy version relies on an older algorithm (IEDB-Recommended 2.22)that is not available on NG.
Users can get close to reproducing the Legacy CD4Episcore output by selecting the ‘7-allele’ panel and ‘Consensus’ as the prediction method.
References
Reference for CD4episcore: Frontiers: Predicting HLA CD4 Immunogenicity in Human Populations
Reference for 7_allele method for CD4episcore: ScienceDirect: Development and validation of a broad scheme for prediction of HLA class II restricted T cell epitopes
Input Data
CD4Episcore uses the same input sequences as binding predictions. Enter amino acid sequences in the Input Sequence box using the formats described in Getting Started — Input Sequence Formats.
Parameter Selection
CD4Episcore is allele independent, but allele selection still controls the binding predictors that can be chained with it. To closely reproduce the Legacy CD4Episcore output, select the ‘7-allele’ panel and ‘Consensus’ as the binding prediction method.
Results
CD4Episcore outputs and tables
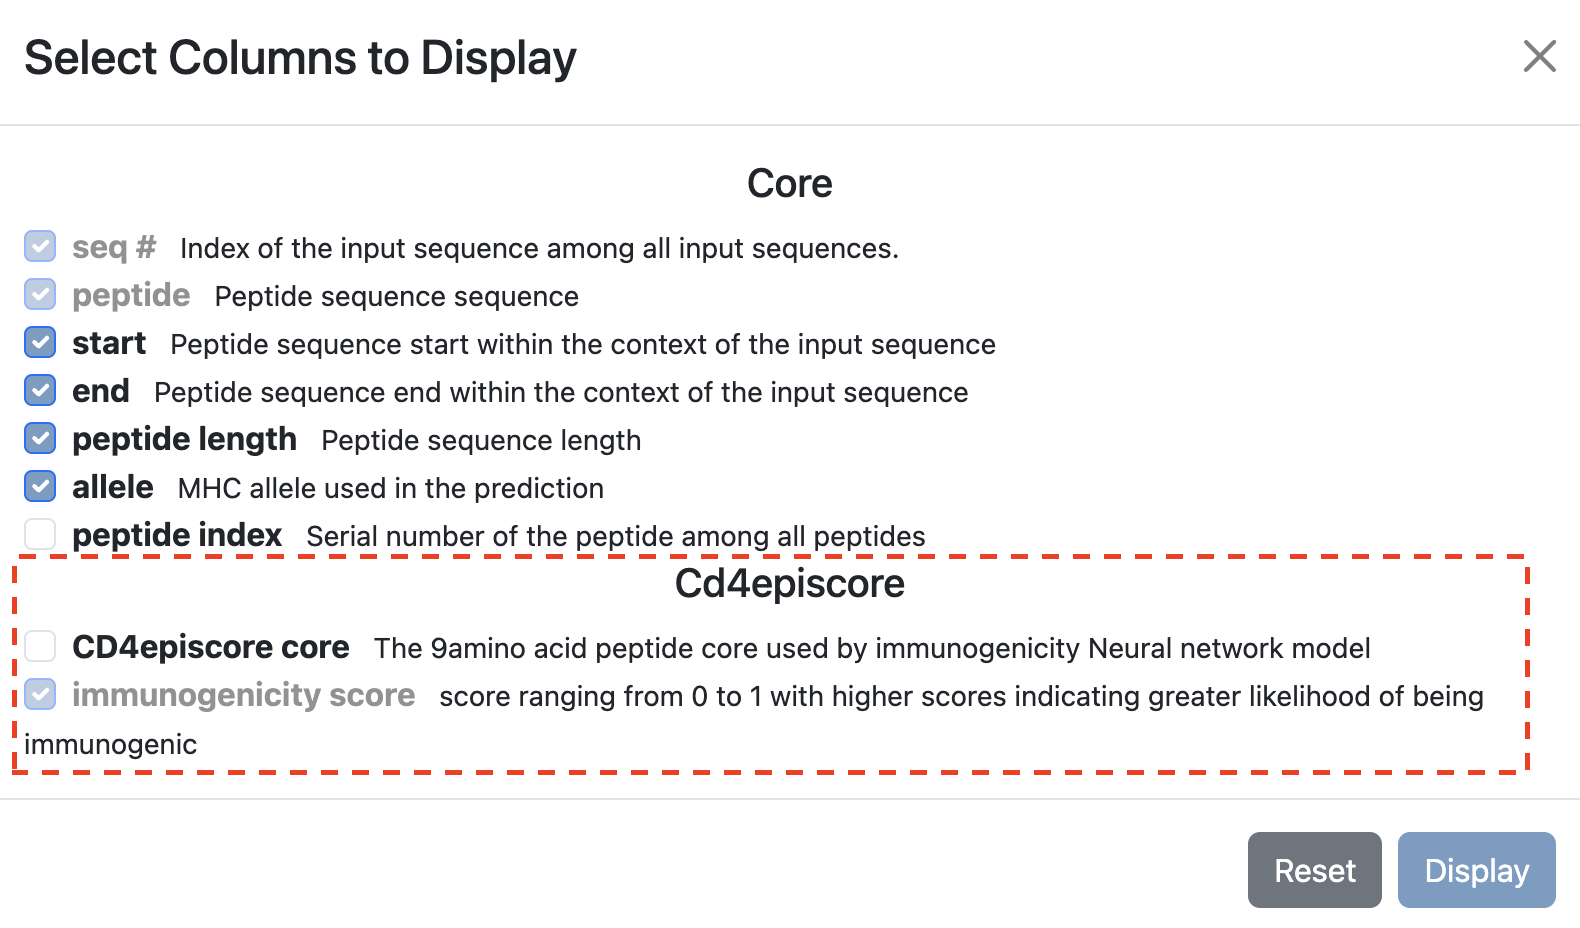
A. Immunogenicity as the Only Predictor
Selecting CD4Episcore as the only prediction method will output the following table:
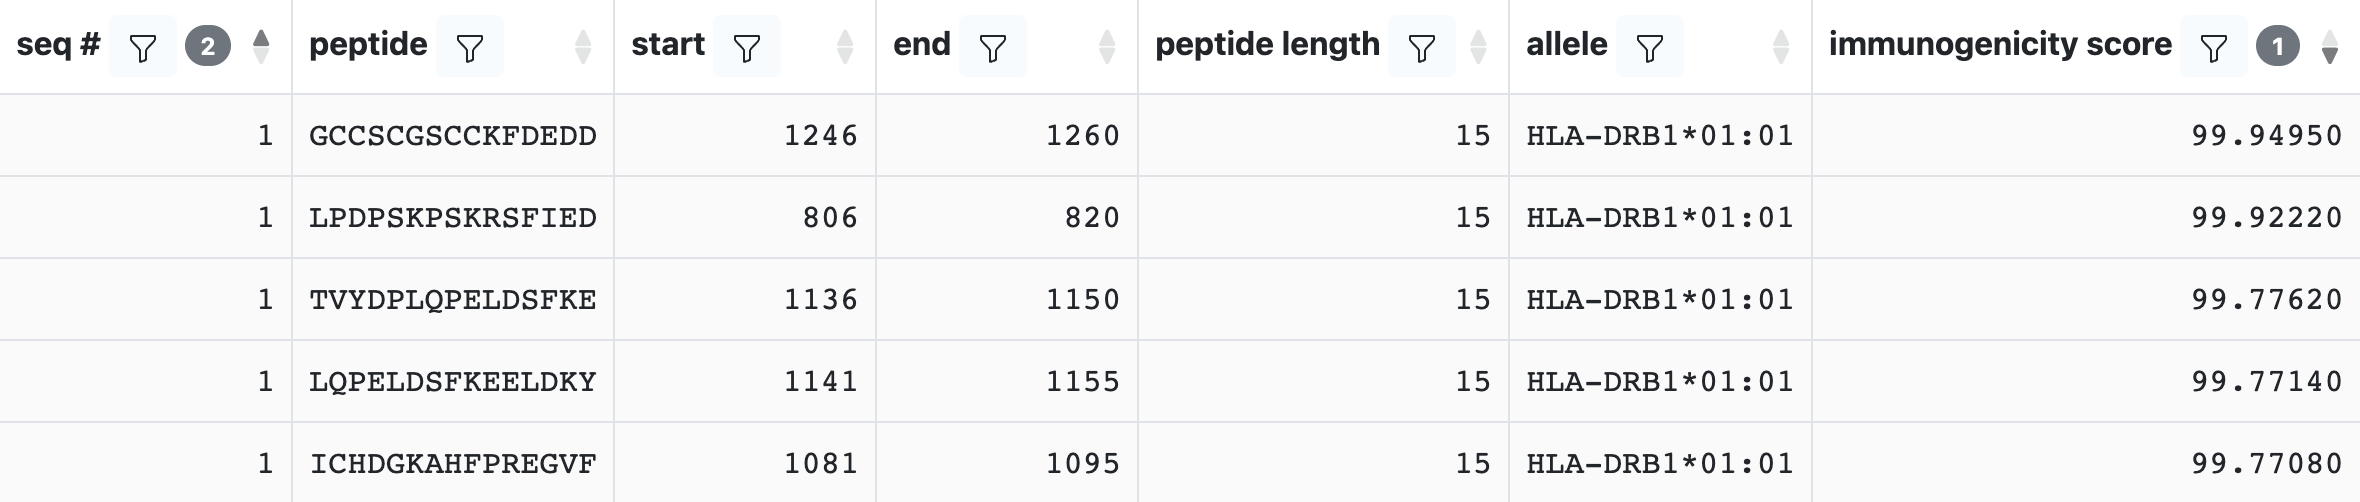
Running an Immunogenicity prediction will add a column called Immunogenicity Score to the output. The Immunogenicity Score ranges from 0 to 100, with low values identifying more immunogenic peptides and high values non-immunogenic peptides.
B. Binding + Immunogenicity as Predictors
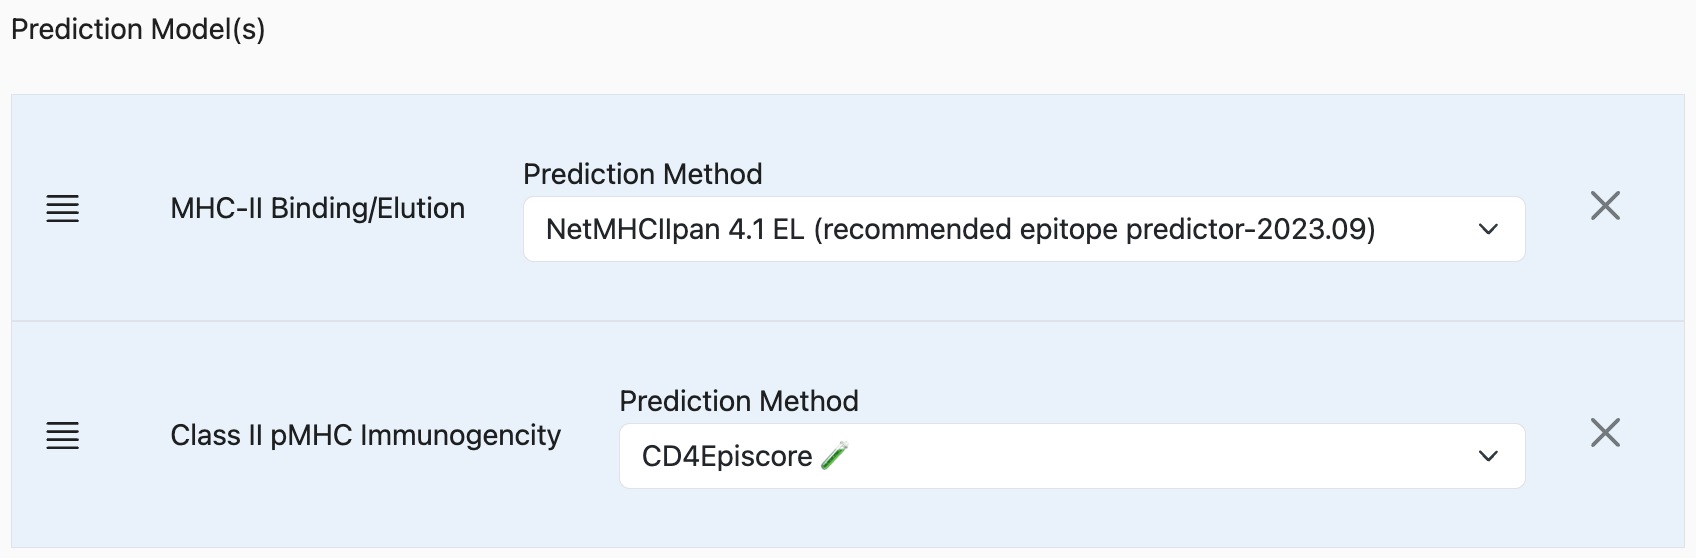
Chaining the binding prediction with the Immunogenicity will output the following peptide table:
The result table will contain the binding prediction output data (median binding percentile, netmhciipan_el core, netmhciipan_el score, netmhciipan_el percentile), immunogenicity score, and additional data called Immunogenicity Combined Score.
Combined Score is given by combining both HLA binding and the immunogenicity prediction which presumably incorporate the capacity of being recognized by TCR; And low value identifying high capacity of being recognized by TCR.
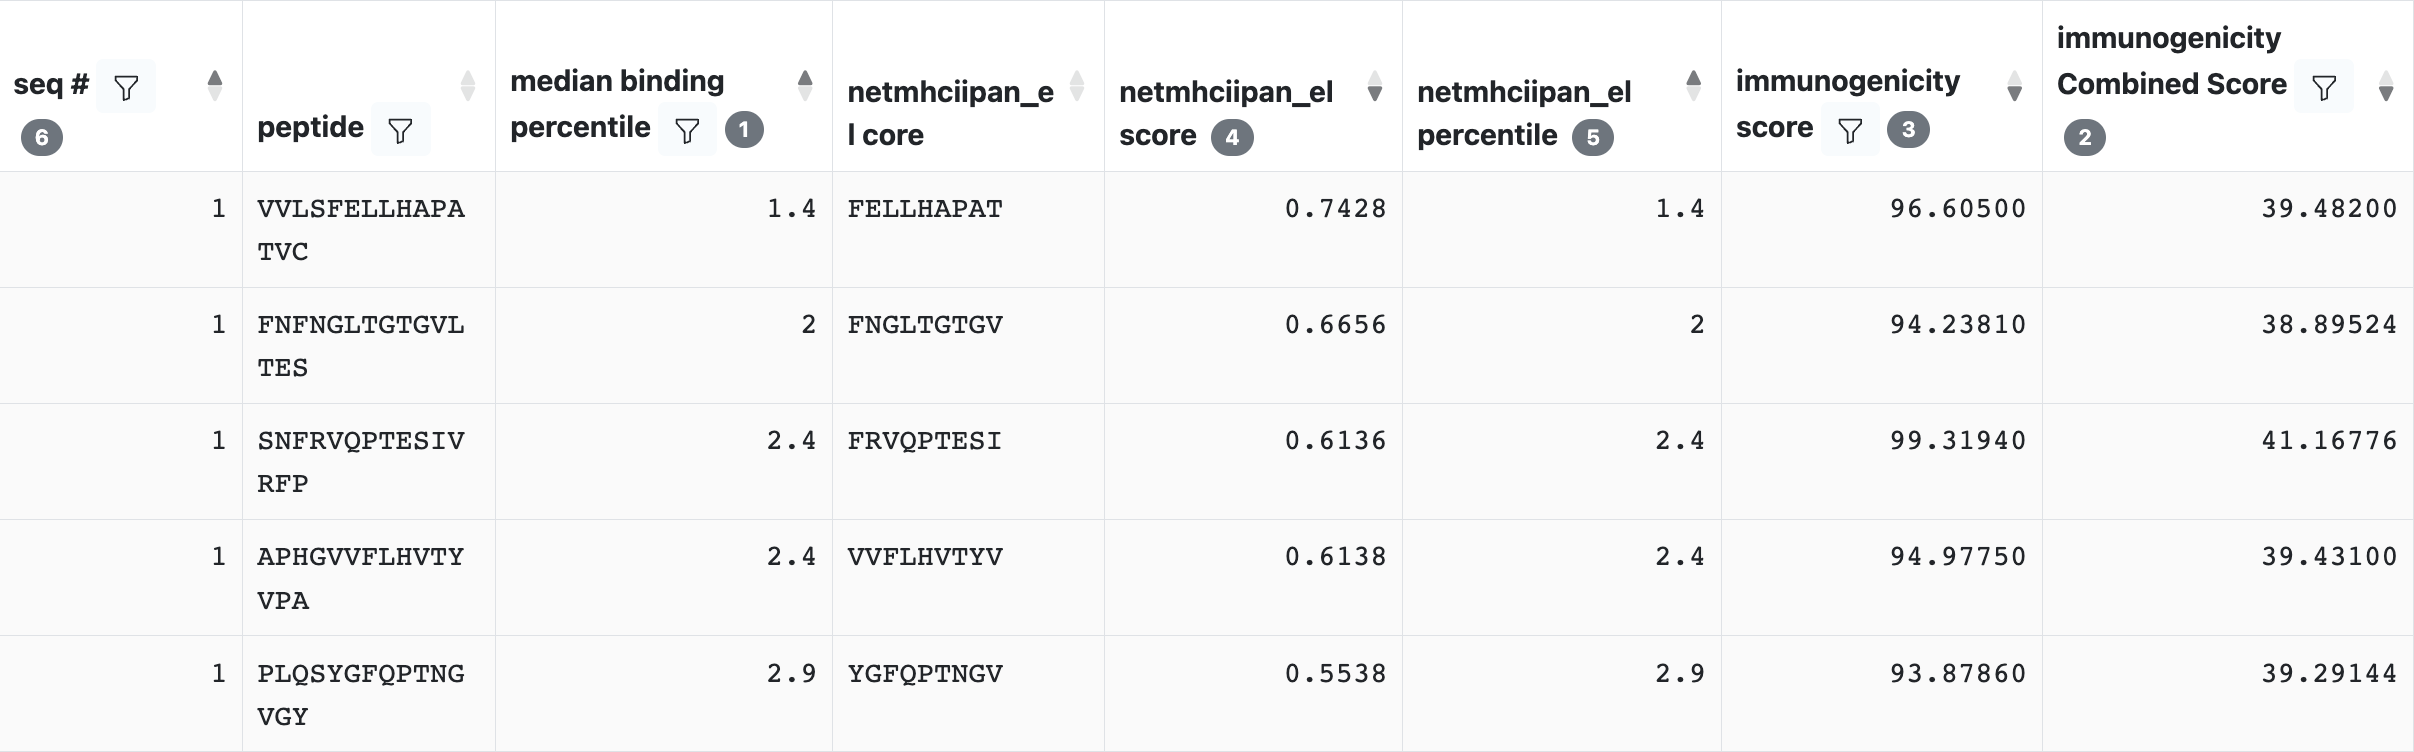
Peptide Core
The peptide core is a 9-mer amino acid sequence used by the immunogenicity Neural network model. By default, CD4episcore’s peptide core is not displayed on the table. To view the peptide core on the table, please enable it from the Display Columns.
Consolidated peptide table
In addition to the ‘peptide table’, which includes one row for every peptide and allele combination, the ‘consolidated peptide table’ is available on the second tab of the results. This table includes one row per peptide and is essentially a pivot-table that includes columns for all percentile rank values across all alleles and methods for the peptide.
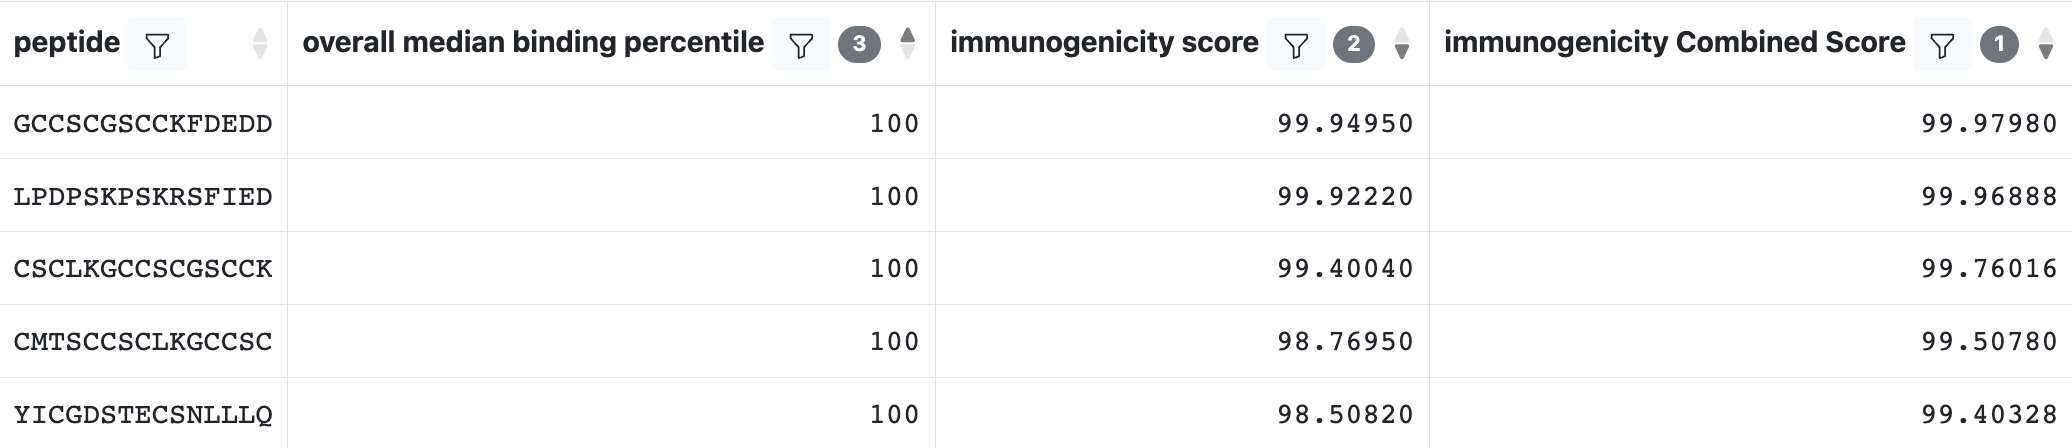
This table format enables users to reproduce the functionality of the ‘7-allele’ method from the CD4episcore tool, while allowing users to select alternate alleles and methods.
Processing Predictions
Method
By integrating the proteolytic processing step into prediction models, the MHCII-NP tool provides a more comprehensive approach to identifying naturally presented MHC class II ligands.
Note
More details on the method can be obtained from the reference: [PMID: 30127785]
Input Data
MHCII-NP uses the same input sequences as binding predictions. Enter amino acid sequences in the Input Sequence box using the formats described in Getting Started — Input Sequence Formats.
Parameter Selection
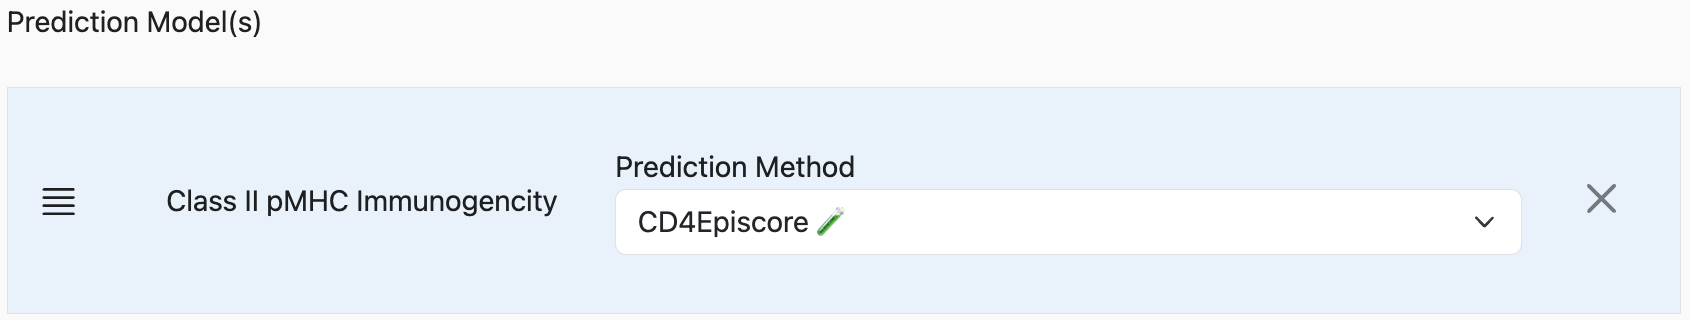
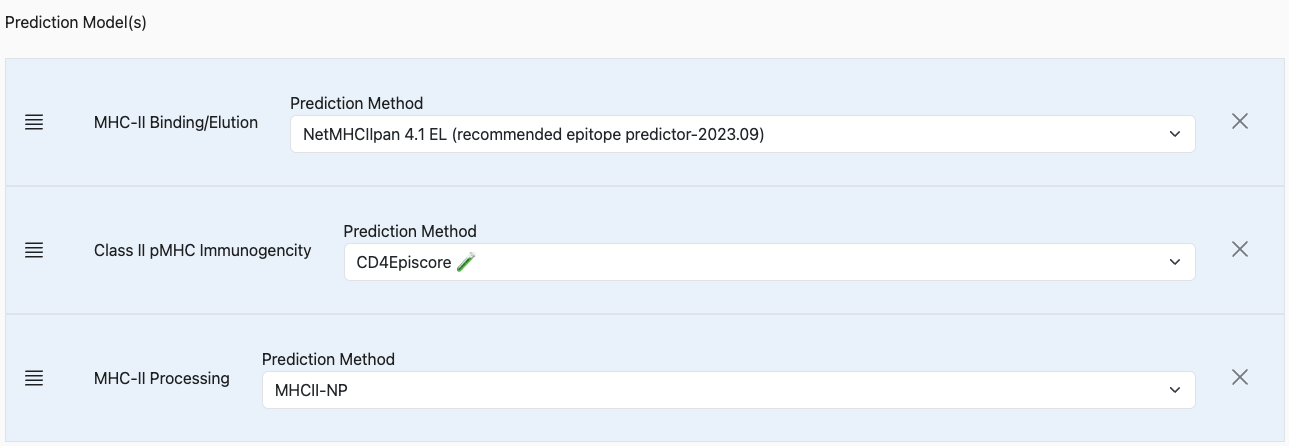
Adding MHCII-NP to the prediction
Click the Add Another Prediction > MHC-II Processing. This will add MHCII-NP method to the prediction model.
Results
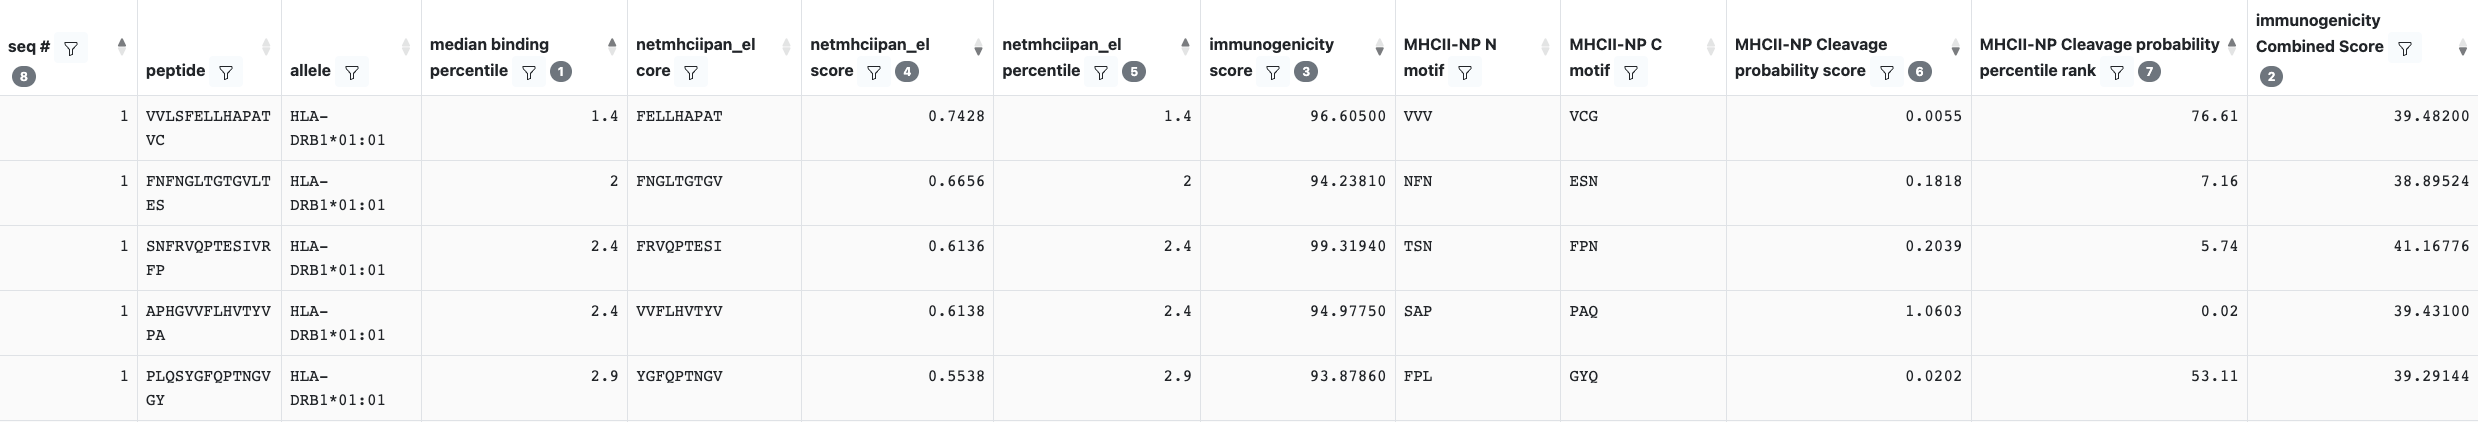
The output table will look like below.
Column descriptions
MHCII-NP N motif / C motif:The N and C termini considered for calculated the cleavage probability score.
MHCII-NP Cleavage probability score: he cleavage probability score indicates the probability of the peptide being an MHC II ligand based on three components: (1) the peptide length (2) the N-terminus cleavage motif and (3) the C-terminus cleavage motif. The higher the numerical value of cleavage probability score, the better is the chance of the peptide being a ligand.
MHCII-NP Cleavage probability percentile rank: The predicted cleavage probability score in terms of percentile ranks per the corresponding source protein. The lower the numerical value of the percentile score, the better is the chance of the peptide being a ligand.
The higher the numerical value of cleavage probability score and the lower the numerical value of the percentile score, the better is the chance of the peptide being a ligand.