Cluster
The Cluster tool groups epitopes into clusters based on sequence identity. A cluster is a group of sequences with sequence similarity above the minimum identity threshold.
Methods
General basis: Peptides are represented as nodes; edges connect peptides with sequence identity above the threshold. Singletons are isolated peptides that share no identity above the threshold with any other peptide.
The figure below represents a clustering result with 5 peptides (A, B, C, D, E) depicted as circles:
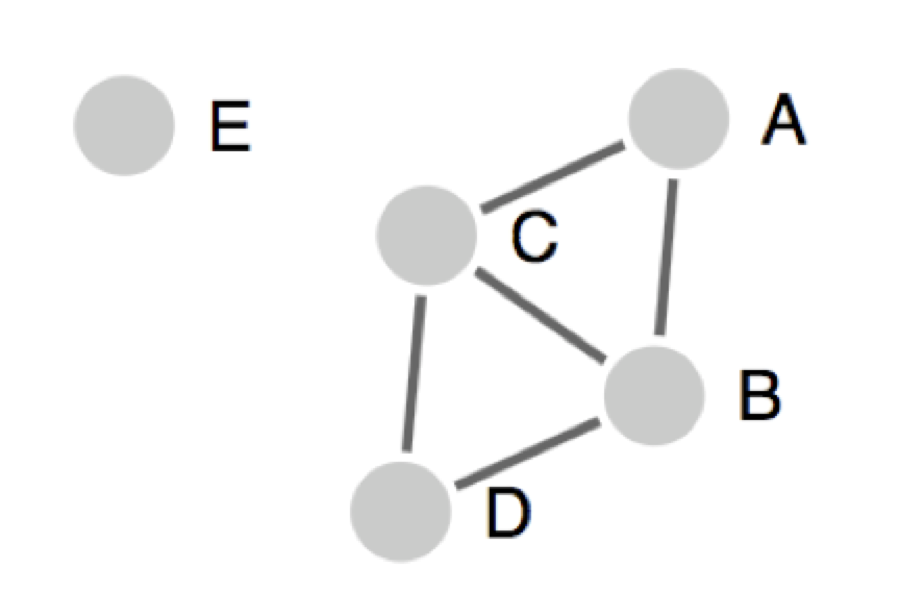
Lines (edges) connecting two peptides indicate identity above the specified threshold. Singletons are isolated peptides, like peptide E, that don’t share sequence identity above the selected threshold with any other peptides.
All the connected peptides in clusters
Groups all peptides homologous at a specified level; members may have lower homology to each other.
All peptides homologous at a pre-specified level (e.g., 70%) are clustered together. Any member is at least 70% homologous to at least one other member. Drawback: members may be related at much lower homology, so the cluster may not yield a clear consensus sequence.
In the figure: A, B, C, D form one cluster; E is a singleton. A and D are not directly connected but belong to the same cluster.
Reference: Dhanda SK, Vaughan K, Schulten V, Grifoni A, Weiskopf D, Sidney J, Peters B, Sette A. 2018. Development of a novel clustering tool for linear peptide sequences. Immunology 155(3):331–345. [DOI: 10.1111/imm.12984] [PMID: 30014462]
Cluster-break for clear representative sequence (Recommended)
Breaks clusters into subclusters so each yields a clean consensus; no peptide in two sub-clusters.
Extension of the first approach: clusters are broken into subclusters so each subcluster has a representative sequence. No peptide appears in two clusters/sub-clusters.
In the figure: A, B, C, D form one cluster with possible sub-clusters; E is a singleton.
Fully interconnected clusters (cliques)
All members share homology above threshold; one peptide can belong to multiple cliques.
All peptides in a cluster are fully interconnected and share homology above the threshold. One peptide can belong to multiple cliques.
In the figure: A, B, C form one clique; B, C, D form a second. B and C appear in both. E is a singleton.
Input Data
The Cluster tool accepts epitope sequences as input:
Sequence Text: Enter epitope sequence(s) in PLAIN or FASTA format directly into the input field.
File Upload: Upload epitope sequence(s) from a file.
Note
On the next-generation Tools site, the Cluster tool is typically used as a step within the T cell, class I pipeline, where sequence input is provided by the preceding pipeline step.
Parameter Selection
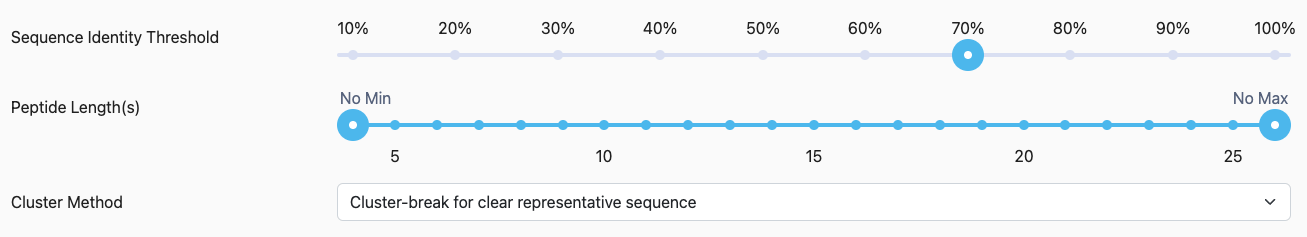
Sequence Identity Threshold: Select the sequence identity threshold at which to calculate epitope clusters.
Peptide Length(s): Select the minimum and maximum length of peptides to consider.
Cluster Method: Select one of the three approaches (described in Methods above).
Results
Tabular Results
The following tables and views are available:
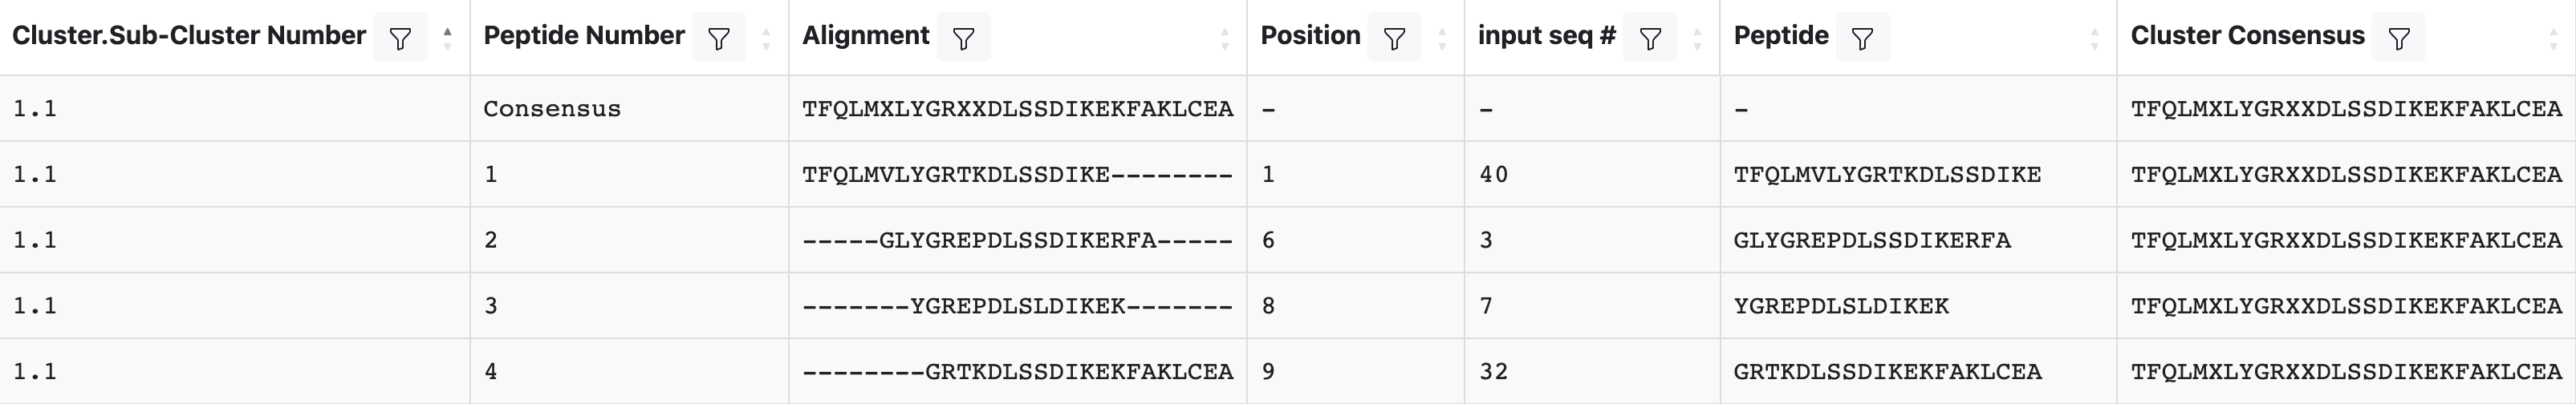
Peptide Table: Clustered peptides with alignment, position, and consensus. Use “Display Columns” to show or hide columns. Table controls: Download, Reset Table, Display Columns, Save Table State, and pagination. The Cluster Method dropdown at the top filters results by clustering approach. Subclusters with the same digit before the decimal (e.g., 1.1, 1.2, 1.3) are derived from common parental clusters.
Peptide Table columns
cluster.sub-cluster number: Serial number of the cluster (parental cluster) and subcluster, separated by a period.
peptide number: Serial number of the peptide within the cluster, starting with 1 at the N terminus of the cluster.
alignment: Alignment of the peptide to the cluster.
position: Position of the peptide within the alignment/consensus of the cluster.
input seq id: Index of the peptide among the input sequences.
peptide: Peptide sequence.
cluster consensus: Consensus sequence of the cluster, built from the alignment.
Sequence Table: Simplified list of all peptides.
Sequence Table columns
seq #: Numerical identifier for each sequence.
sequence name: Name of the peptide (e.g.,
Mus Pep1,Rat Pep17).sequence: Amino acid sequence of the peptide.
Cluster Visualization
Interactive graph of clusters. Use Visualize a selected Sub-cluster to view all clusters (All) or a specific sub-cluster (e.g., 1.1, 2.1, 3.1). Peptide sequences appear on mouseover.
Example: Cluster visualization
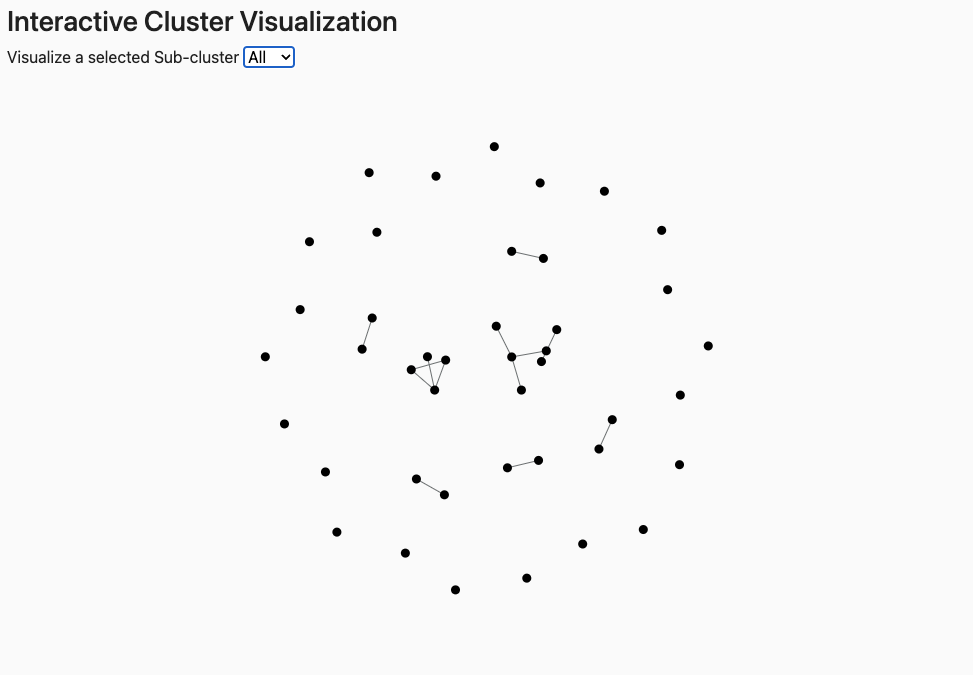
Elements: Nodes = peptides; edges connect peptides with sequence identity above the threshold. Connected nodes = same cluster; isolated nodes = singletons.
Note
The visualization may be difficult to discern with large datasets.
Interpreting Results
Clusters group peptides by sequence identity; the consensus is the representative sequence for each sub-cluster.
Note
Use the consensus sequence as the canonical representative for each cluster in downstream analysis.
The Peptide Table and Sequence Table display clustered peptides and their alignments.
Consensus sequence: The first row in each sub-cluster is the consensus—a representative sequence for the cluster.
Sub-cluster numbering: Sub-clusters with the same major number (e.g., 1.1, 1.2, 1.3) originate from the same parental cluster.
Clique overlap: With “Fully interconnected clusters (cliques)”, a peptide can appear in multiple cliques.
The Visualization tab shows a graph where nodes = peptides and edges = sequence identity above the threshold.
Example: Cluster visualization
Connected nodes: Belong to the same cluster.
Isolated nodes: Singletons with no identity above threshold to any other peptide.
Sub-cluster selector: Use the dropdown to view all clusters (
All) or a specific sub-cluster (e.g.,1.1,2.1).