PepX
The Peptide eXpression annotator (pepX) takes a peptide as input, identifies from which proteins the peptide can be derived, and returns an estimate of the expression level of those source proteins from selected public databases (“Peptide/Gene Summary” tab on the results page).
PepX also accumulates those expression levels and provides an estimate for the abundance level of the peptide (“Peptide Summary” tab on the results page).
The PepX database currently contains all peptides from the Ensembl GRCh38, release 106. This fasta file was used to derive all possible peptides, excluding those that are shorter than 8 amino acids or contain ‘X’.
Parameter Selection
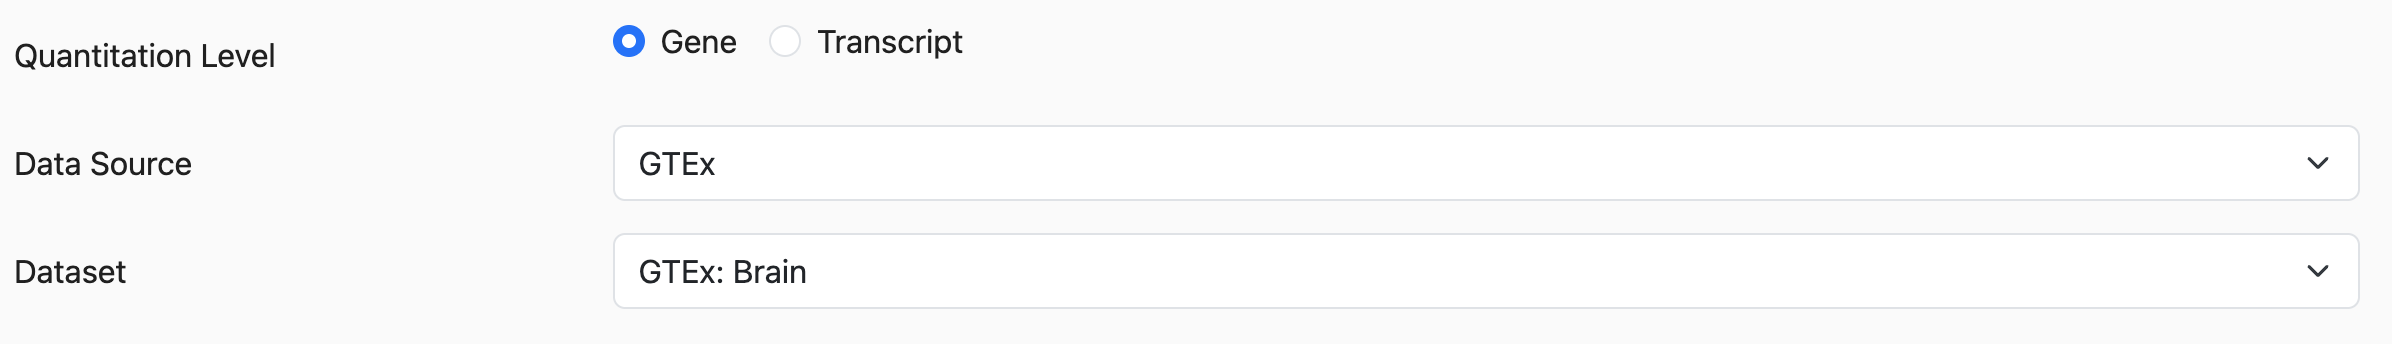
Quantitation Level
Indicates to retrieve either gene-level or transcript-level TPM values from the expression data.
Data Source / Dataset
HPA (Uhlen et al., 2010)
Pre-calculated gene-level and transcript-level TPM values for 256 healthy tissues were downloaded from the Human Protein Atlas (HPA).
GTEx (Carithers and Moore, 2015)
Pre-calculated gene-level and transcript-level TPM values for 54 healthy tissue subtypes were downloaded from The Genotype-Tissue Expression (GTEx) project data portal. Median TPM values were calculated for each of the 31 main tissue types.
TCGA (Goldman et al., 2020)
Pre-calculated gene-level and transcript-level TPM values for the TCGA Pan-cancer cohort for 33 cancer types were downloaded from the UCSC Xena data pages.
CCLE (Ghandi et al., 2019)
Pre-calculated gene-level and transcript-level TPM values for 1,019 cell lines were downloaded from the Cancer Cell Line Encyclopedia (CCLE).
RNA-Seq data of a B721.221 cell line (Abelin et al., 2017)
Only gene-level expression data is available.
HeLa cell line (Cantarella et al., 2019)
Only gene-level expression data is available.
Note
All datasets were downloaded in July 2022.
Results
The PepX tool returns two tables: Peptide Table and Peptide Gene Summary Table.
1. Peptide Table (Gene)
This table has 1 row per input peptide. Data for all genes in which the peptide is found are collapsed here.
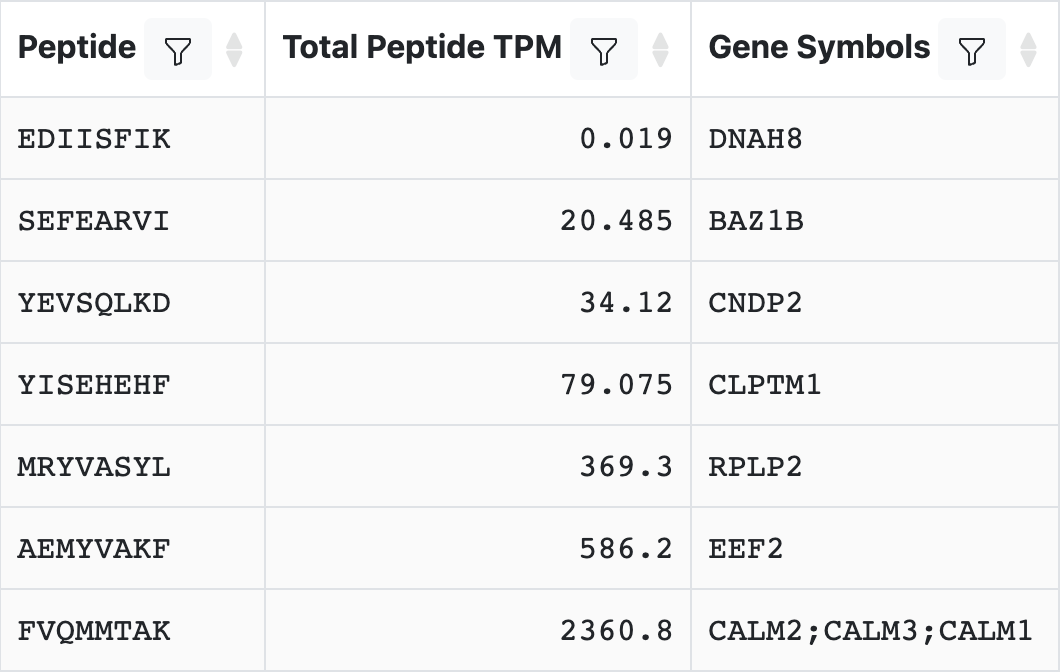
It is defaulted to show only Total Peptide TPM and Gene Symbols. However, through Display Columns, more information can be displayed on the table.
Many of the fields are lists of values derived from the peptide/gene summary table, where you will find associated descriptions.
| Field | Description | Example |
|---|---|---|
| Peptide | Peptide sequence | MQKEITAL |
| Gene Symbol | List of gene symbols where peptide is found. | ACTB;ACTA2;ACTA1;ACTC1;ACTG2;ACTG1 |
| Total Peptide TPM | Sum of Peptide TPMs for all genes. | 9093.988 |
| Median Peptide TPM | Median Peptide TPM for all genes. | 37.008 |
| Total Scaled Peptide TPM | Sum of Scaled Peptide TPMs for all genes. | 6498.506 |
| Median Scaled Peptide TPM | Median Scaled Peptide TPM for all genes. | 12.408 |
| Gene ENSG IDs | List of corresponding Ensembl gene identifiers. | ENSG00000075624;ENSG00000107796;ENSG00000143632;ENSG00000159251;ENSG00000163017;ENSG00000184009 |
| Gene TPMs | List of Gene TPMs for corresponding genes. | 5209;73.763;0.252;0.0045;0.048;3810.92 |
| Peptide TPMs | List of Peptide TPMs for corresponding genes. | 5209.000;73.763;0.252;0.005;0.048;3810.920 |
| Scaled Peptide TPMs | List of Scaled Peptide TPMs for corresponding genes. | 3062.892;24.563;0.252;0.005;0.021;3410.773 |
| Proteins Encoded by Gene | List of 'Proteins Encoded by Gene' for corresponding genes. | 17;3;3;1;7;19 |
| Proteins Containing Peptide (per Gene) | List of 'Proteins Containing Peptide' for corresponding genes. | 10;1;3;1;3;17 |
| Fraction of Proteins Containing Peptide (per Gene) | List of 'Fraction of Matching Proteins' for corresonding genes. | 0.588;0.333;1.000;1.000;0.429;0.895 |
| Gene Mean Occurrences per Protein | List of 'Mean Occurrences per Protein' for corresponding genes. | 1.000;1.000;1.000;1.000;1.000;1.000 |
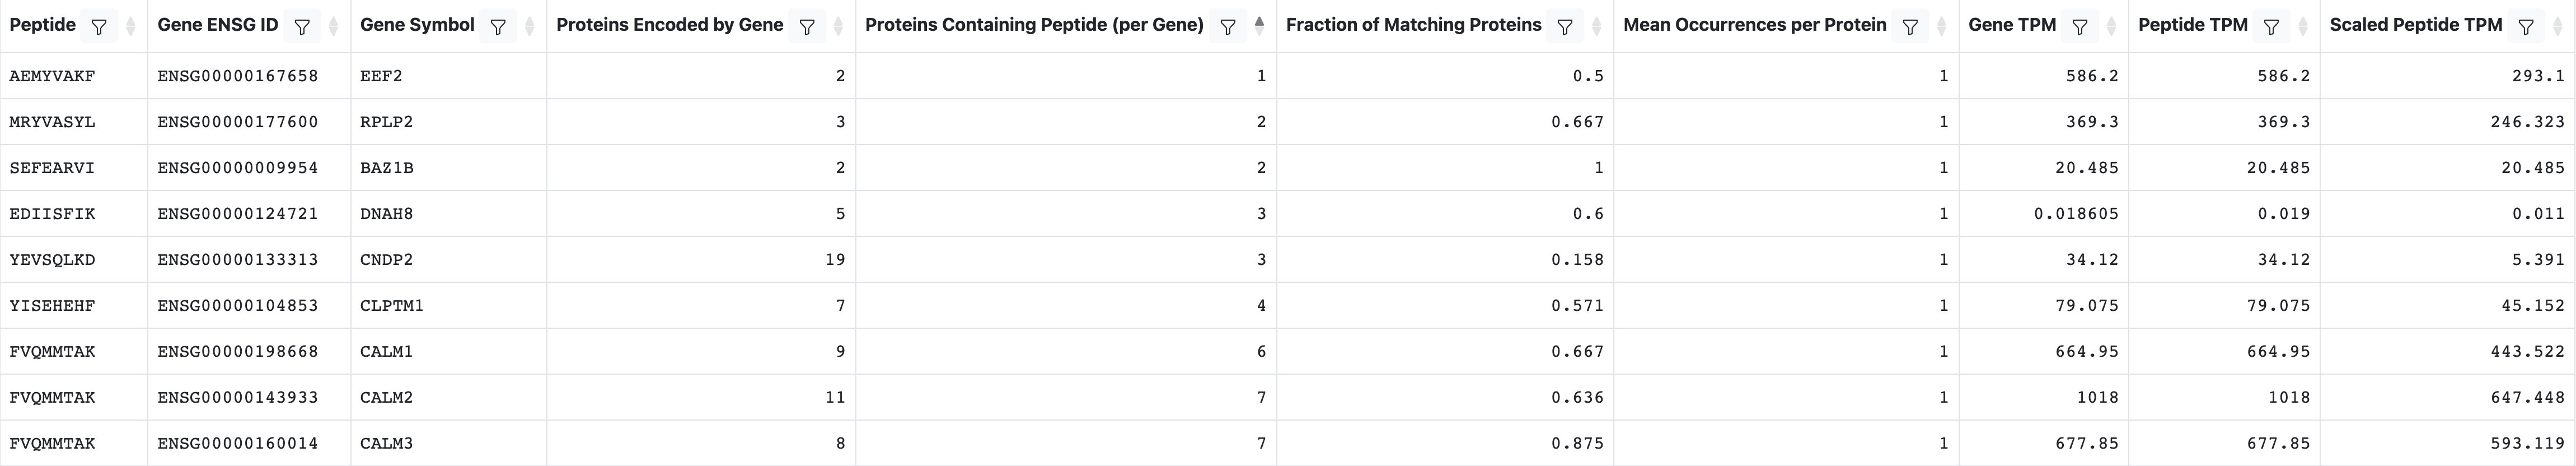
2. Peptide Gene Summary Table
This table has 1 row per input peptide and matched gene.
| Field | Description | Example |
|---|---|---|
| Peptide | Peptide sequence | HETTFNSI |
| Gene ENSG ID | Ensembl gene identifier | ENSG00000075624 |
| Gene Symbol | HGVS gene symbol | ACTB |
| Proteins Encoded by Gene | Number of proteins/transcripts associated with the gene | 17 |
| Proteins Containing Peptide | Number of proteins/transcripts associated with the gene that also contain the peptide | 9 |
| Fraction of Matching Proteins | Fraction of proteins/transcripts associated with the gene that also contain the peptide | 0.529 |
| Mean Occurrences per Protein | The total number of occurrences of this peptide divided by 'Proteins Containing Peptide'.This will usually be 1 except in unusual circumstances.(e.g., low-complexity peptides, repetative genes, etc.) | 1 |
| Gene TPM | TPM of the gene | 5209 |
| Peptide TPM | Gene TPM x Mean Occurrenced per Protein | 5209 |
| Scaled Peptide TPM | Gene TPM x Fraction of Matching Proteins | 2755.561 |
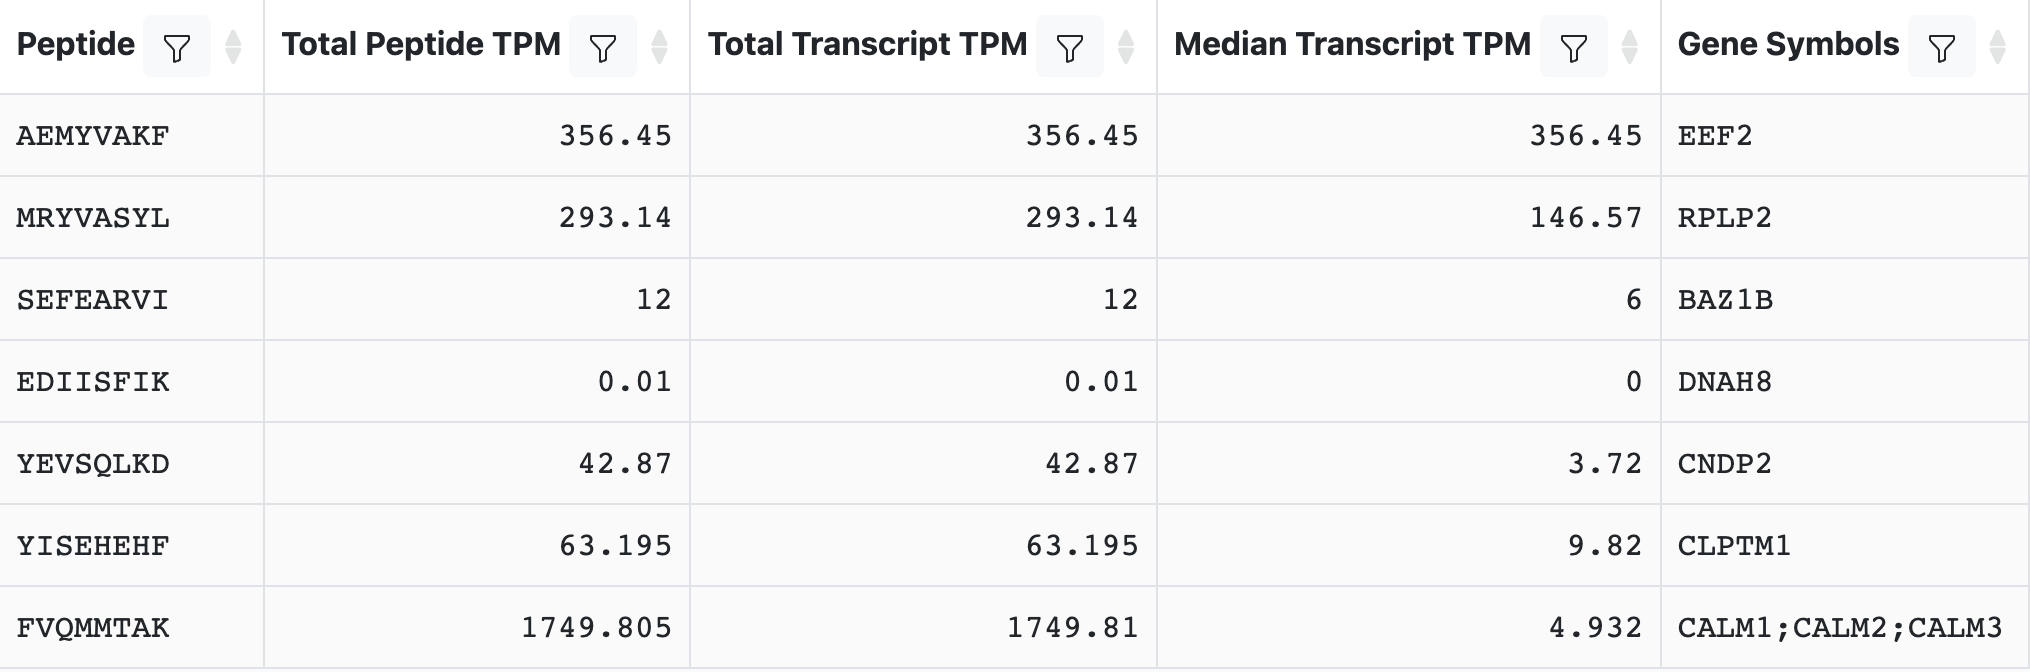
3. Peptide Table (Transcript)
This table has 1 row per input peptide and matched transcript.
| Field | Description | Example |
|---|---|---|
| Peptide | See peptide summary for genes | MQKEITAL |
| Gene Symbols | See peptide summary for genes | ACTA1;ACTA2;ACTB;ACTC1;ACTG1;ACTG2 |
| Total Peptide TPM | Sum of the Peptide TPMs for all transcripts in all genes where the peptide occurs. | 5815.28 |
| Median Peptide TPM | Median Peptide TPM over all transcripts in all genes in which the peptide occurs. | 0.83 |
| Number of Genes | Number of genes with transcripts encoding the peptide. | 6 |
| Number of Transcripts | Number of transcripts encoding the peptide. | 35 |
| Gene ENSG IDs | See peptide summary for genes. | ENSG00000075624;ENSG00000107796;ENSG00000143632;ENSG00000159251;ENSG00000163017;ENSG00000184009 |
| Protein ENSP IDs | List of Ensembl protein identifiers containing the peptide. | ENSP00000224784;ENSP00000290378;ENSP00000295137;ENSP00000355644;ENSP00000355645;ENSP00000386857;ENSP00000386929;ENSP00000407473;ENSP00000458162;ENSP00000458435;ENSP00000459119;ENSP00000459124;ENSP00000460464;ENSP00000460660;ENSP00000461407;ENSP00000461672;ENSP00000466346;ENSP00000477968;ENSP00000493648;ENSP00000494269;ENSP00000494750;ENSP00000495059;ENSP00000495995;ENSP00000496101;ENSP00000501773;ENSP00000501862;ENSP00000502286;ENSP00000502821;ENSP00000505060;ENSP00000505193;ENSP00000505235;ENSP00000506126;ENSP00000506201;ENSP00000506253;ENSP00000508084 |
| Number of Transcript Occurences | List of 'Number of Occurrences' for corresponding transcripts. | 1;1;1;1;1;1;1;1;1;1;1;1;1;1;1;1;1;1;1;1;1;1;1;1;1;1;1;1;1;1;1;1;1;1;1 |
| Transcript TPMs | List of individual Transcript TPM values. | 0.37;0;0;0.04;0;0;0;14.62;1.26;2951.5;0.48;0.31;0;1.48;78.18;156.79;8.04;0.16;34.47;5.07;2468.8;0.69;1.54;39.26;1.37;0;34.65;6.61;2.69;5.95;0.12;0;0.83;0;0 |
| Transcript Peptide TPMs | List of individual Peptide TPM values. | 0.370;0.000;0.000;0.040;0.000;0.000;0.000;14.620;1.260;2951.500;0.480;0.310;0.000;1.480;78.180;156.790;8.040;0.160;34.470;5.070;2468.800;0.690;1.540;39.260;1.370;0.000;34.650;6.610;2.690;5.950;0.120;0.000;0.830;0.000;0.000 |
4. Peptide Transcript Summary Table
This table has 1 row per input peptide and matched transcript.
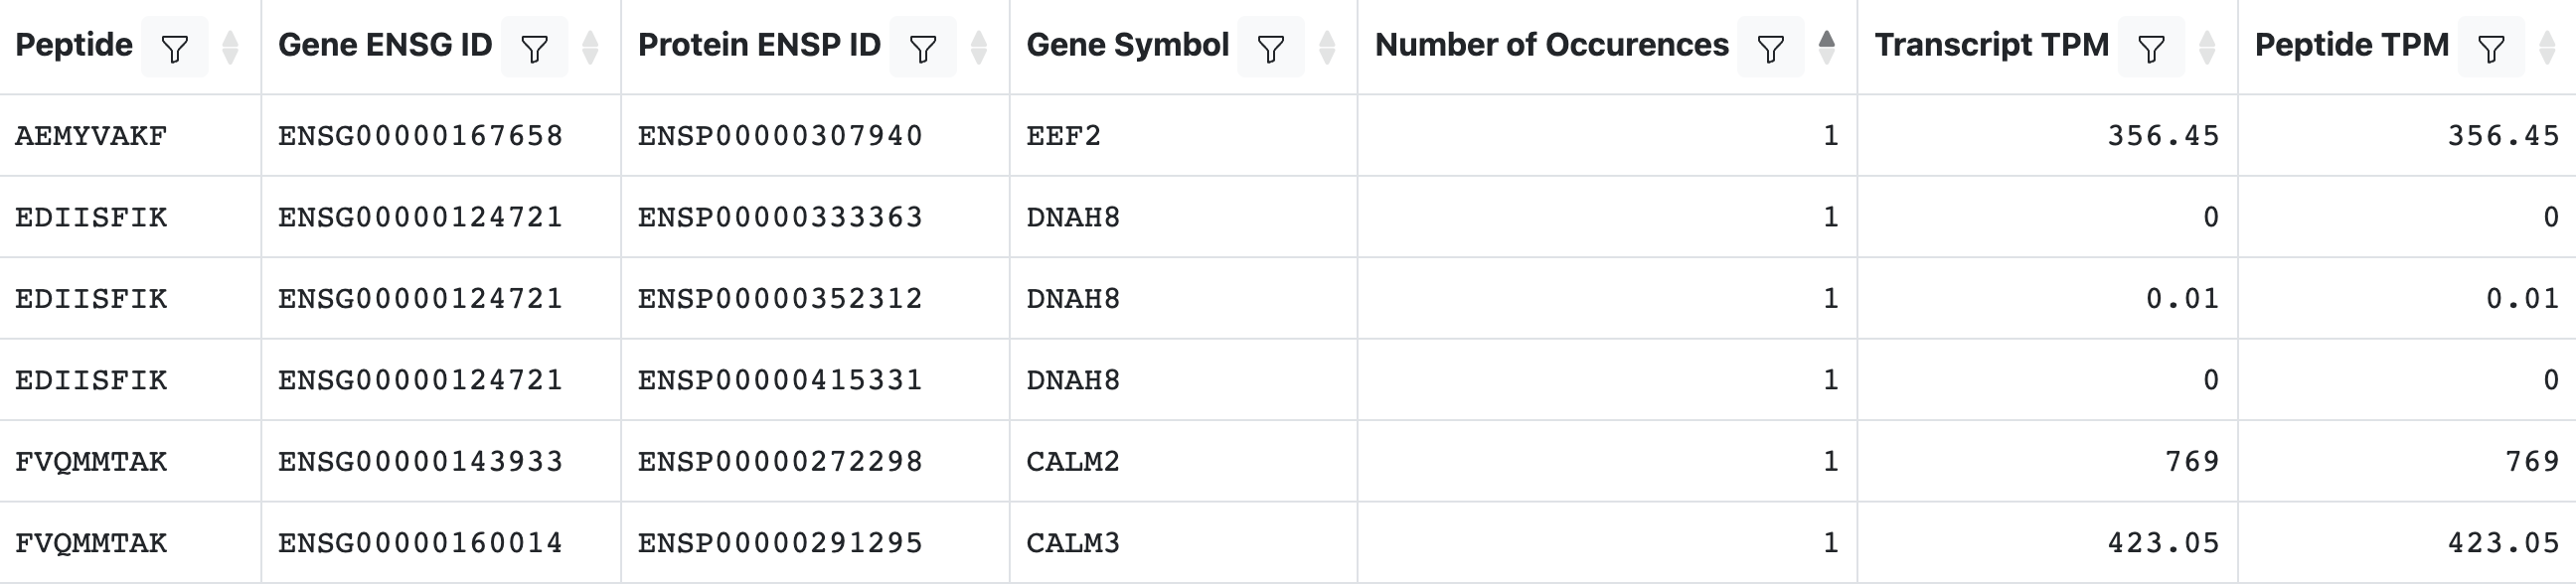
| Field | Description | Example |
|---|---|---|
| Peptide | See peptide/gene summary | HETTFNSI |
| Gene ENSG ID | See peptide/gene summary | ENSG00000184009 |
| Protein ENSP ID | Ensembl protein identifer | ENSP00000458435 |
| Gene Symbol | See peptide/gene summary | ACTG1 |
| Number of Occurences | The number of times the peptide appears in the transcript/protein.In most cases, this will be 1. | 1 |
| Transcript TPM | TPM of the transcript. | 2951.5 |
| Peptide TPM | Transcript TPM x Number of Occurrences. | 2951.5 |