T cell class I
The T cell class I tool combines MHC class I binding, TAP processing, and immunogenicity tools into one application. This allows users to easily run the individual predictors on the same input dataset and compile the results into one table. Below, we describe all of the available methods.
Binding Predictions
Method
The tools in this group take amino acid sequences and MHC alleles as input to predict the strength of the peptide: MHC interaction. Depending upon the tool selected, the main output will be a predicted IC50 value (lower indicates stronger predicted binding) or a score. To make comparisons between alleles and methods more standardized, a percentile rank score is also returned where lower always indicates stronger binding or higher probability of elution (depending upon the predictor). The percentile rank is the fraction of peptides drawn randomly from UniProt that would elicit predicted affinity/score as strong as or better than the current peptide.
Available binding and elution predictors
The methods below can be classified as binding or epitope predictors based upon the datasets upon which they were trained and the outputs they produce.
Binding predictors (denoted with [B]) predict the strength of the peptide:MHC interaction, regardless of whether the peptide can be naturally processed and presented
Epitope predictors (denoted with [E]) are trained on eluted ligand data and thus inherently take into account the natural antigen processing pathways, in addition to the strength of the peptide:MHC interaction
[E] NetMHCpan EL 4.1 (IEDB recommended epitope predictor 2023.09)
Predicts elution of peptides from MHC molecules using artificial neural networks (ANNs). The method is trained on a combination of more than 850,000 quantitative Binding Affinity (BA) and Mass-Spectrometry Eluted Ligands (EL) peptides. The EL data covers 177 MHC molecules from human (HLA-A, B, C, E), mouse (H-2), cattle (BoLA), primates (Patr, Mamu, Gogo), swine (SLA), equine (Eqca) and dog (DLA).
[PMID: 32406916]
[B] NetMHCpan BA 4.1 (IEDB recommended binding predictor 2023.09)
Predicts binding of peptides to MHC molecules using artificial neural networks (ANNs). The method is trained on a combination of more than 850,000 quantitative Binding Affinity (BA) and Mass-Spectrometry Eluted Ligands (EL) peptides. The BA data covers 170 MHC molecules from human (HLA-A, B, C, E), mouse (H-2), cattle (BoLA), primates (Patr, Mamu, Gogo), swine (SLA) and equine (Eqca).
[PMID: 32406916]
[B] Consensus (legacy)
The Consensus predictor was developed based on the idea that combining predictions from multiple methods could improve performance compared to any individual predictor. For MHC-I, an early implementation of this approach is described in Moutaftsi et al. (Nat Biotech, 2006). The Consensus method integrates predictions from Artificial Neural Networks (ANN), the Stabilized Matrix Method (SMM), and Comblib_Sidney2008, using as many of these methods as applicable based on the chosen allele and peptide length.
[PMID: 16767078]
[B] ANN 4.0
Artificial Neural Networks (ANNs) can make highly sensitive and quantitative predictions of peptide binding to MHC class I molecules. In this study, the neural network was trained using peptide sequences with known quantitative affinities for a specific MHC molecule.
There are various implementations of artificial neural networks, and the one used here follows the model described by Nielsen et al. (Protein Science, 2003) for predicting HLA-A2 binding. This approach has been successfully applied to multiple alleles and is available as part of the NetMHC service.
[PMID: 12717023]
[B] SMM 1.0
The Stabilized Matrix Method (SMM) described by Peters and Sette (BMC Bioinformatics, 2005) can be applied to calculate matrices from quantitative affinity data of peptides binding to MHC molecules. The advantage of this method is that it suppresses the noise present in the training data, caused by the inevitable experimental error as well as the limited number of data points.
[PMID: 15927070]
[B] SMMPMBEC 1.0
The Stabilized Matrix Method with a Peptide:MHC Binding Energy Covariance Matrix (SMMPMBEC) is an enhanced version of the SMM approach. Unlike SMM, it addresses the issue of sparse peptide sequence coverage commonly found in binding datasets by incorporating Peptide:MHC Binding Energy Covariance (PMBEC). The PMBEC matrix was derived from experimentally determined binding affinity measurements using combinatorial peptide libraries. SMMPMBEC is detailed in Kim et al., BMC Bioinformatics, 2009.
[PMID: 19948066]
[B] Comblib_Sidney2008 1.0
Comblib_Sidney2008 refers to a set of scoring matrix-based predictors derived from binding affinity measurements of combinatorial peptide libraries against a panel of MHC alleles, as described in Sidney et al. (Immunome Res., 2008). These predictors are unique in that they directly measure the average binding energy contribution of a given residue at a specific position, eliminating concerns about limited peptide sequence coverage.
[PMID: 18221540]
[E] MHCFlurry 2.0
Predicts MHC class I presentation that combines new models for MHC class I binding and antigen processing.
[PMID: 18221540]
[E] MHC-NP
Predicts peptides naturally processed by the MHC Class I pathway (“eluted peptides”) for each target MHC molecule.
[PMID: 18221540]
Input Data
Enter amino acid sequences in the Input Sequence box using the formats covered in Getting Started — Input Sequence Formats. Set peptide length (8–15) or use as-is for pre-defined peptides, and choose MHC class I allele(s).
Parameter Selection
By default, a peptide length of 9 and the HLA-A*02:01 allele are selected. However, by using the peptide length slider and MHC Allele(s) autocomplete, many combinations of peptide lengths and alleles may be submitted simultaneously. Note that additional lengths and alleles will result in predictions taking longer.
Peptide Length
Peptide length can be selected using the slider, which ranges from 8 to 15. Upon submission, protein sequences in the Input Sequence box will be broken up into overlapping peptides of the selected lengths.
as-is - The
as-ischeckbox disables the peptide length slider and results in the sequences from the Input Sequence box being sent directly to the predictors without first breaking up into smaller sequences. This option is recommended to be used when peptides are submitted for prediction as opposed to full-length proteins. When sending peptides from another tool to TC1 in a pipeline, this option should be selected in order to prevent the peptides from being broken up.
MHC Allele(s)
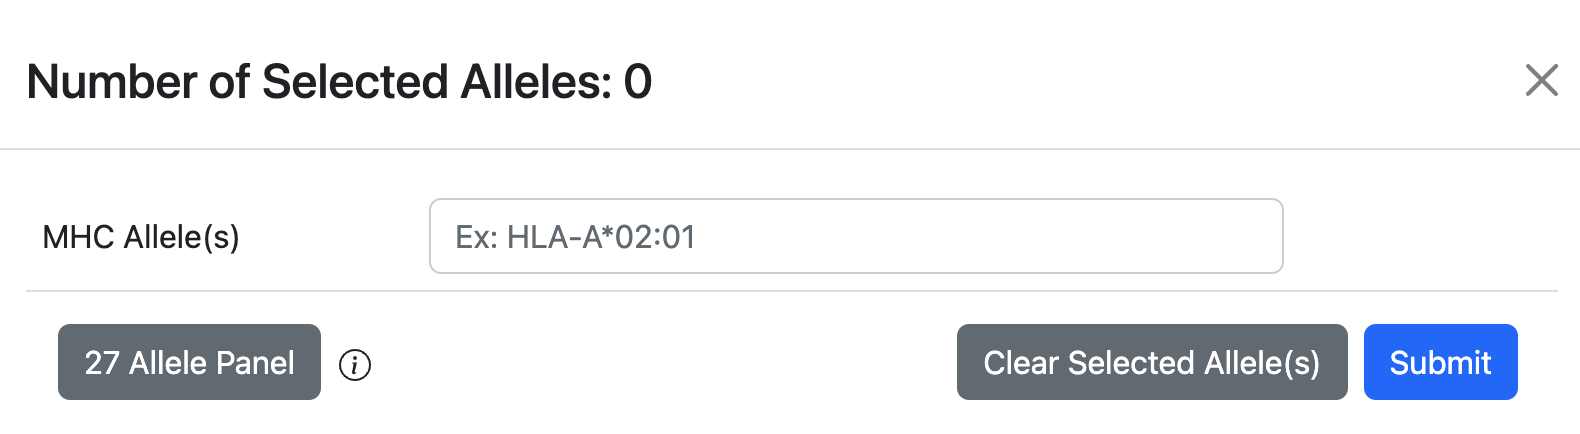
Typing into the MHC Allele(s) text box will autocomplete based on official allele names and synonyms from the MHC Restriction Ontology (MRO). As alleles are selected, they will appear as ‘chips’ in the box immediately below. Alleles can be deselected by clicking on the ‘x’ inside the chips.
The Allele Finder provides some additional controls, including selecting the HLA allele reference panel of 27 alleles as shown below.
Results
Thresholds and interpreting scores
The IEDB currently recommends using the percentile rank as the metric for ranking binding predictions. A percentile rank of <= 1% has been demonstrated to cover 80% of the immune response for many alleles. For more information on selecting thresholds, please consult these guidelines.
Once the prediction is completed, an output table will be displayed similar to the one shown below.
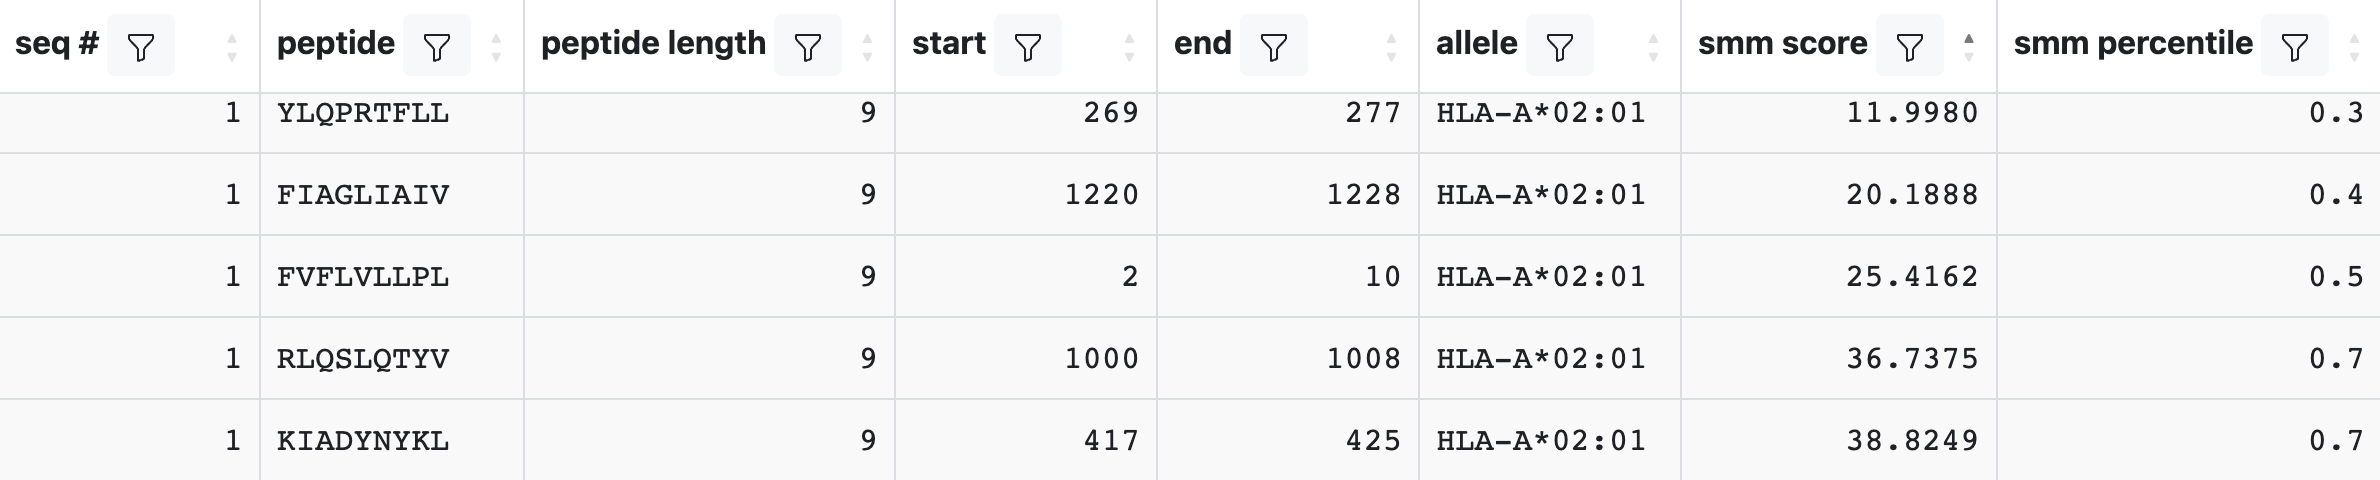
Each row in this table corresponds to one peptide and allele combination. Several columns will always be present, including the seq #, peptide, peptide length, start, end, and allele. Any additional columns returned will depend upon the binding methods that were selected. A description of each field can be found by clicking on the ‘Display Columns’ button.
When the output is returned as IC50 values, a lower number indicates higher affinity. As a rough guideline, peptides with IC50 values <50 nM are considered high affinity, <500 nM intermediate affinity and <5000 nM low affinity. Most known epitopes have a high or intermediate affinity. Some epitopes have a low affinity, but no known T-cell epitope has an IC50 value greater than 5000.
While the output of the predictions is quantitative, there are systematic deviations from experimental IC50 values. For example, the makeup of the training data and the prediction methods used have a non-trivial impact on the range of predicted IC50 values. In addition to the predicted IC50 values or scores, a percentile rank is generated by comparing the peptide’s IC50 against those of a set of random peptides from the UniProt/Swiss-Prot database. The percentile rank is the fraction of peptides drawn randomly from UniProt that would bind as well as or better than the current peptide. Therefore, a low percentile rank indicates high affinity.
When more than one binding method is selected, the median percentile rank of the methods used is also reported.
Percentile Rank Dataset
To establish percentile ranks, the complete “Reviewed (Swiss-Prot)” dataset was downloaded on 10/29/2018. The file contained 558,712 sequences. After filtering for length (minimum 50aa) and predictability (valid amino acids), 544,147 sequences remained. Of those, 10,000 were selected at random as a source of peptides. One peptide of each length (from 8-15) from a random location in each of these protein sequences was drawn to serve as the final background dataset, which is made available here.
Immunogenicity Predictions
Method
This tool uses amino acid properties as well as their position within the peptide to predict the immunogenicity of a peptide: MHC (pMHC) complex.
Input Data
Immunogenicity predictors use the same input sequences as binding predictions. Enter amino acid sequences in the Input Sequence box using the formats covered in Getting Started — Input Sequence Formats.
Parameter Selection
Sequences
Ideally, peptides should be the same length, presented on the same HLA class I molecule, and 9-mers.
When longer peptides are provided, the extra amino acids will be evaluated as if they are inserted after position 5, and as if they have the same properties as an amino acid at position 5 in terms of weighting and masking.
Peptide Length of 9
This method has only been validated on 9mers, though predictions may be made for any length.
Masking Position
This will mask designated positions from the immunogenicity score. The masked positions are dependent on the HLA molecule on which the peptide is presented. As a default, the first, second, and C-terminal positions are masked. For most common HLA class I molecules the default masking scheme can be selected. Additional anchor positions are used for some HLA molecules, which can be used by selecting
Allele Specific. In some cases, a custom mask may be desired and can be entered by selectingCustomand inputting comma-separated numbers.
Custom Masking
The custom masking option will only work when peptides of the same length are provided.
Results
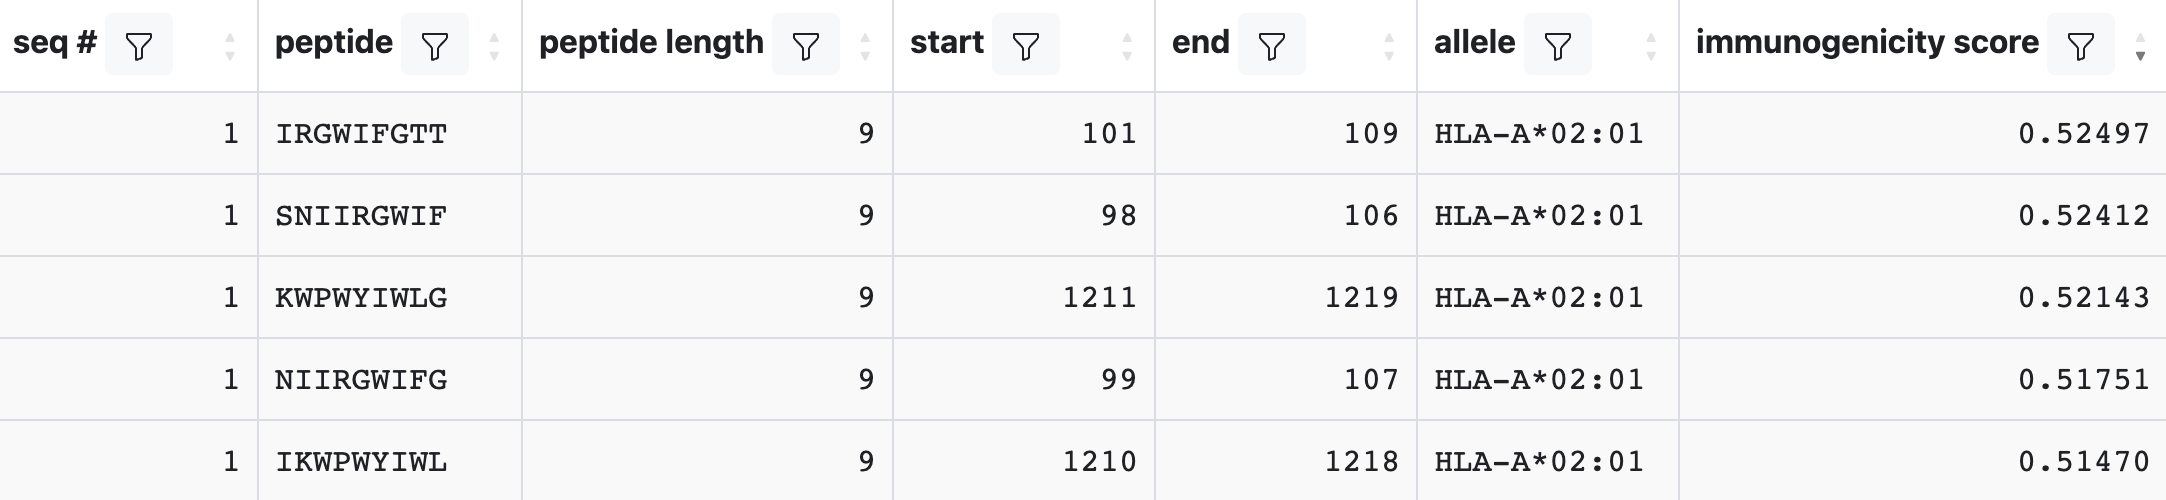
Running an Immunogenicity prediction will add a column called immunogenicity score to the output. Scores greater than 0 indicate the peptide/allele combination is more likely than not to elicit an immune response, while a score less than 0 indicates the inverse.
Processing Predictions
Method
For the prediction of antigen processing through the MHC class I antigen presentation pathway, we incorporated predictions of proteasomal cleavage and TAP transport similar to the MHCPathway website described in (Tenzer et al, CMLS, 2005). The predictions are based on in vitro experiments characterizing the sequence specificity of proteasomal cleavage and TAP transport. The goal of the prediction is to identify MHC-I ligands (peptides that are naturally processed from their source proteins and presented by MHC class I molecules).
Processing predictors
Basic
Proteasomal cleavage predictions assess how efficiently a peptide or its N-terminally extended precursors can be generated from its source protein, while TAP transport predictions evaluate how effectively these peptides are transported into the ER by TAP (Peters et al., Immunol, 2003). When combined with MHC class I binding predictions, these factors provide a comprehensive estimate of a peptide’s likelihood of being presented on the cell surface. The available prediction methods include NetMHCpan BA, ANN, SMM, SMMPMBEC, Comblib_Sidney2008, MHCFlurry, and MHC-NP.
[PMID: 12902473]
NetChop
NetChop uses a neural network to predict cleavage sites of the human proteasome (Kesmir et al., 2002). It accounts for the structurally modified proteasomes found in cells stimulated by gamma-interferon under physiological conditions. Trained on both in vitro data and MHC class I ligand data, NetChop leverages artificial neural network methodology to enhance the accuracy of cleavage site predictions. Although it has been trained exclusively on human data, the conserved nature of proteasome structure suggests that it can also provide reliable predictions for other mammalian proteasomes.
[PMID: 11983929]
NetCTL (historic)
NetCTL (historic) predicts CTL epitopes in protein sequences by integrating peptide-MHC binding predictions with proteasomal C-terminal cleavage and TAP transport efficiency. The method is described in detail by Larsen et al. (Eur J Immunol., 2005).
[PMID: 15997466]
NetCTLpan (historic)
NetCTLpan (historic) is an update to the original NetCTL (historic) server that allows for prediction of CTL epitope with restriction to any MHC molecules of known protein sequence (Stranzl et al., Immunogenetics, 2010).
[PMID: 20379710]
Input Data
Processing predictors use the same input sequences as binding predictions. Enter amino acid sequences in the Input Sequence box using the formats covered in Getting Started — Input Sequence Formats.
Parameter Selection
Basic
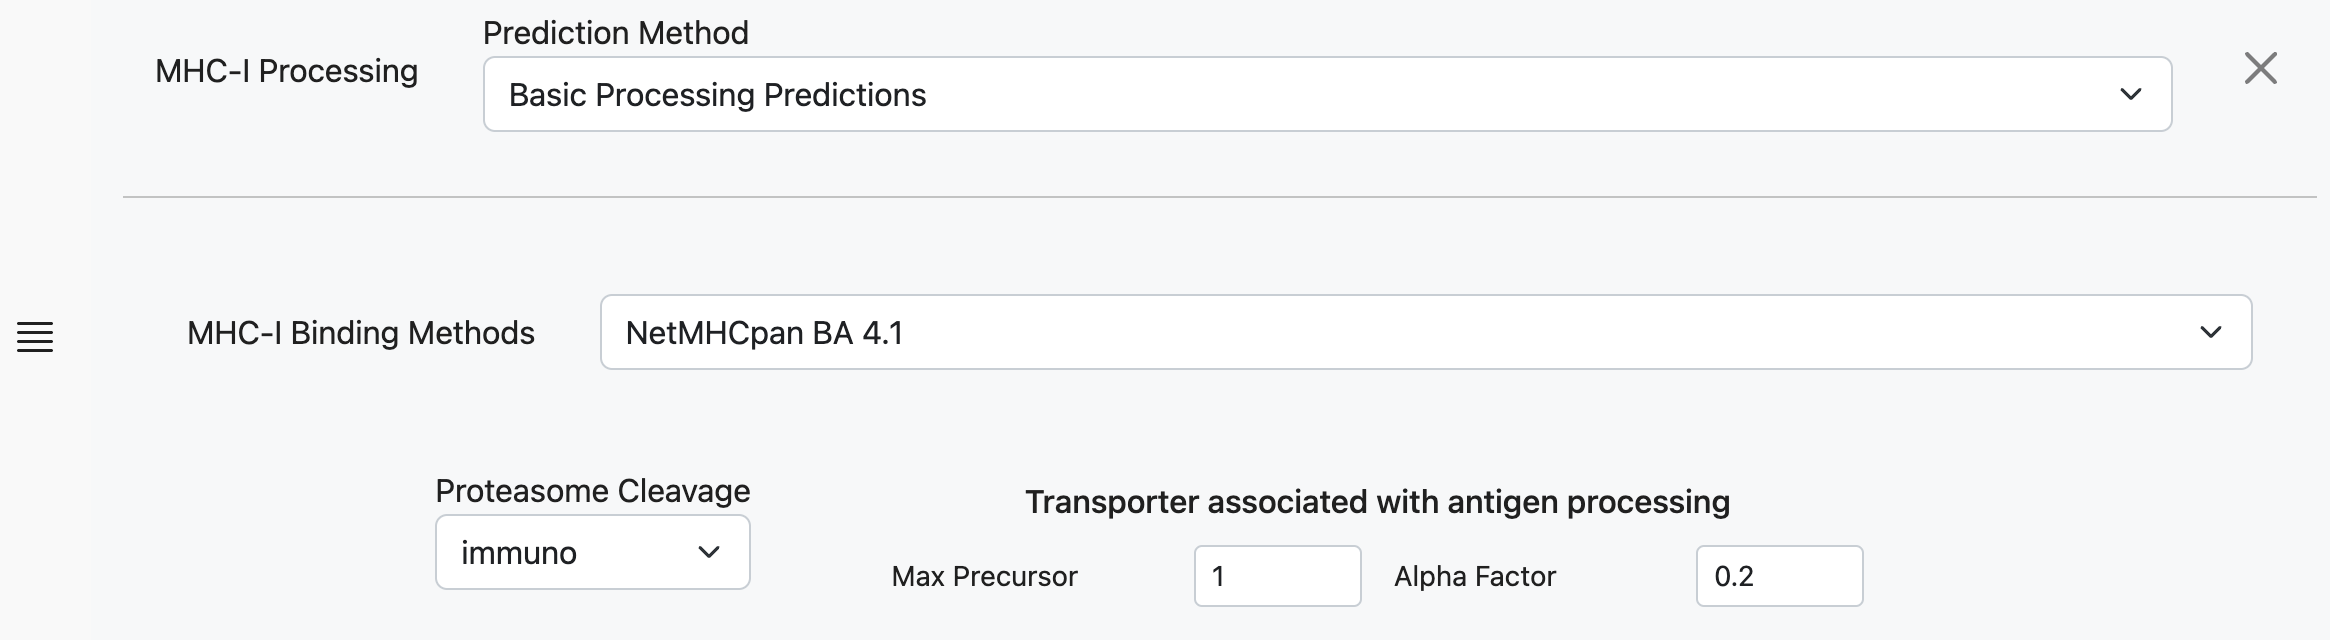
MHC-I Binding Methods
Select the MHC-I binding method that will be used to calculate an IC50 value for incorporation into the combined processing score.
Proteosome Cleavage
There are two types of proteasomes, the constitutively expressed ‘house-keeping’ type, and immunoproteasomes that are induced by IFN-γ secretion. The latter is thought to increase the efficiency of antigen presentation. If you are unsure, select the immunoproteasome type to make a prediction. The predictions are based on in vitro proteasomal digests of the enolase and casein proteins as described here.
Max Precursor Extension
The maximum number of additional amino acids to consider at the N terminus when calculating the TAP score for a given peptide.
Alpha Factor
The factor by which to down-weight the N terminus score with respect to the C terminus. A default of 0.2 worked best in the original publication.
Note
The proteasome and TAP predictions were developed using experimental data for human versions of the molecule. At least for TAP molecules, there are known to be some species-dependent differences in specificity. Therefore, using these predictions for epitope processing in non-human cells should only be done with extra caution in interpreting results.
NetChop
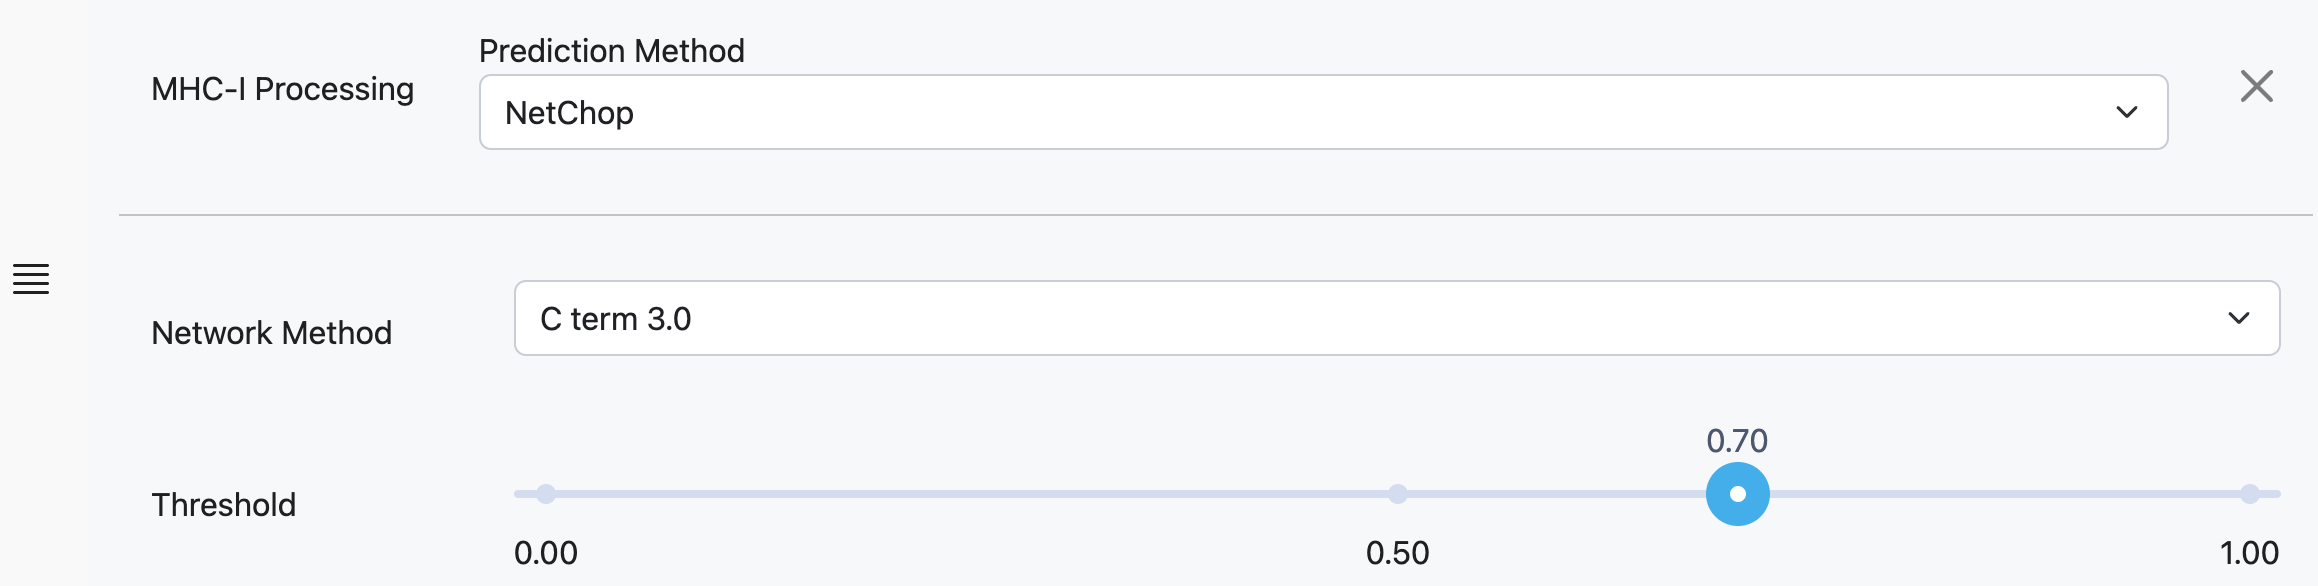
Network Method
NetChop was trained on two different datasets:
C Term 3.0: A dataset of MHC Class I ligands from 188 human proteins.
20S 30: In vivo degradation data by human 20S constitutive proteasome for two proteins, enolase and β-casein.
Threshold
Threshold for plotting prediction scores. This threshold can be adjusted after predictions are complete.
NetCTL (historic)
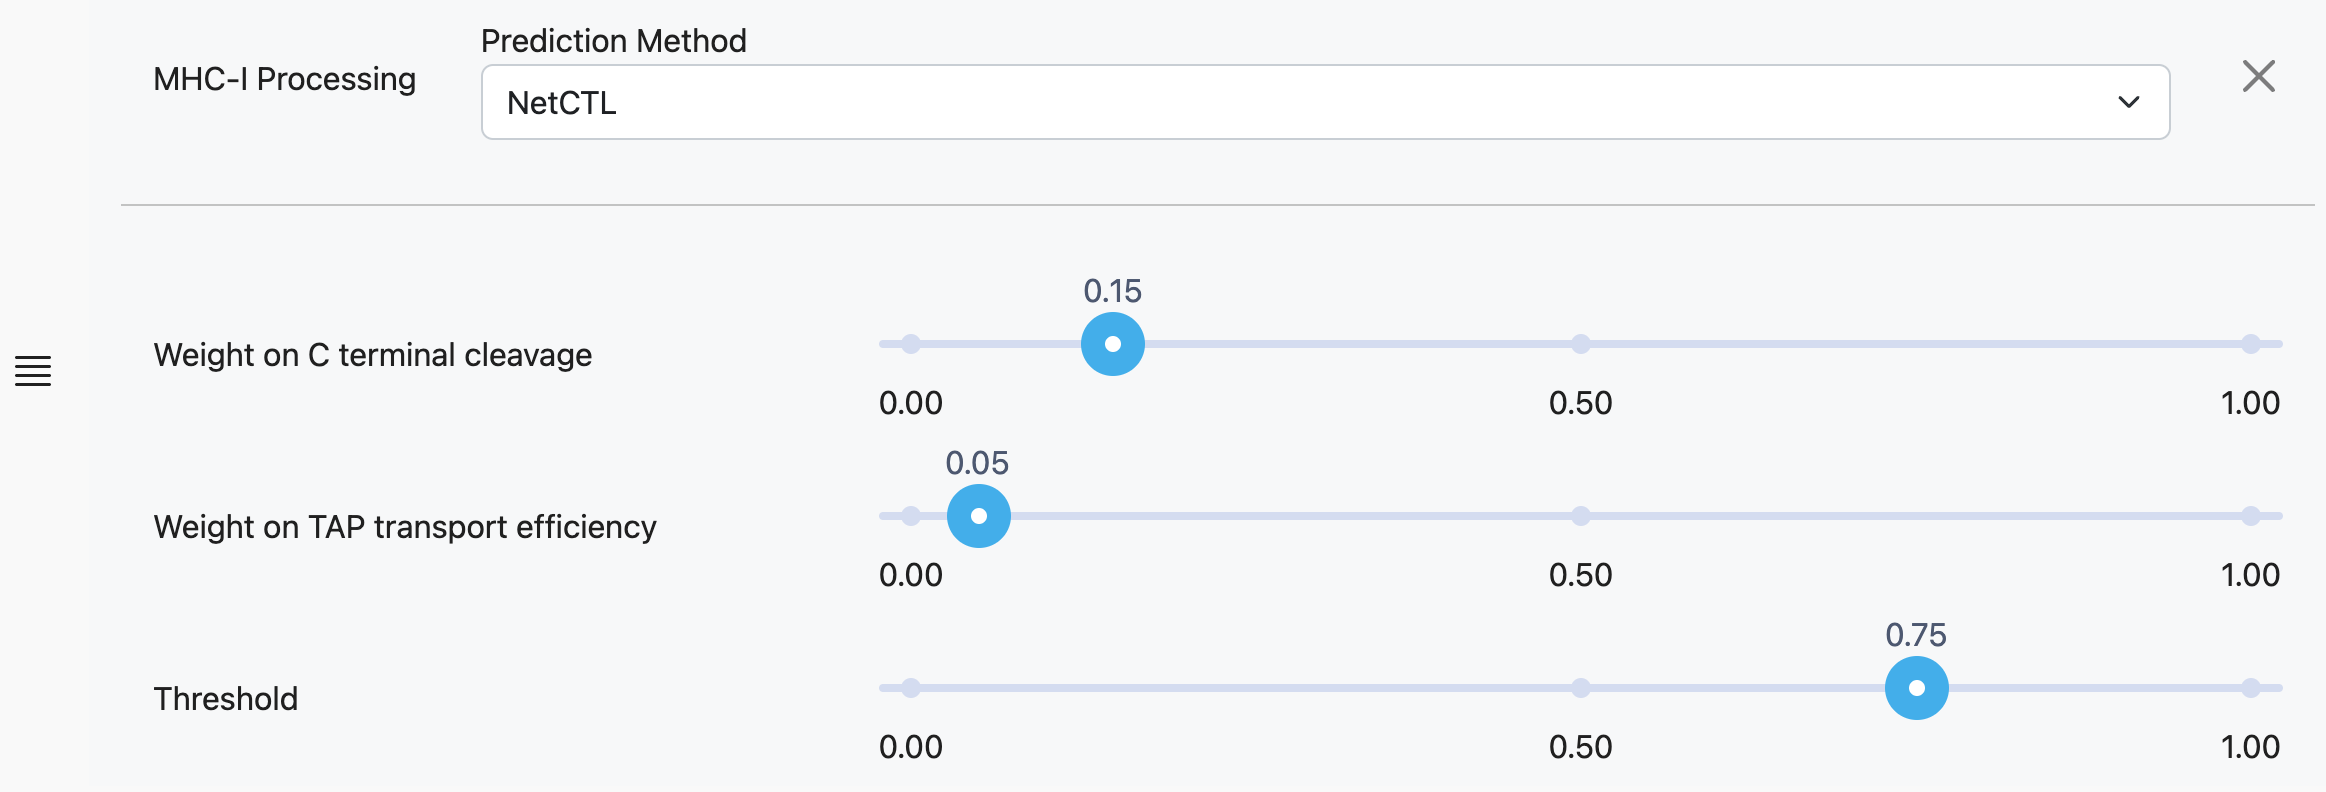
Weight on C Terminal Cleavage
Relative weight on proteasomal cleavage.
Weight on TAP Transport Efficiency
Relative weight on TAP transport efficiency predicted using the weight matrix-based method described by Peters et al., 2003.
Threshold
Threshold for plotting prediction scores. This threshold can be adjusted after predictions are complete.
NetCTLpan (historic)
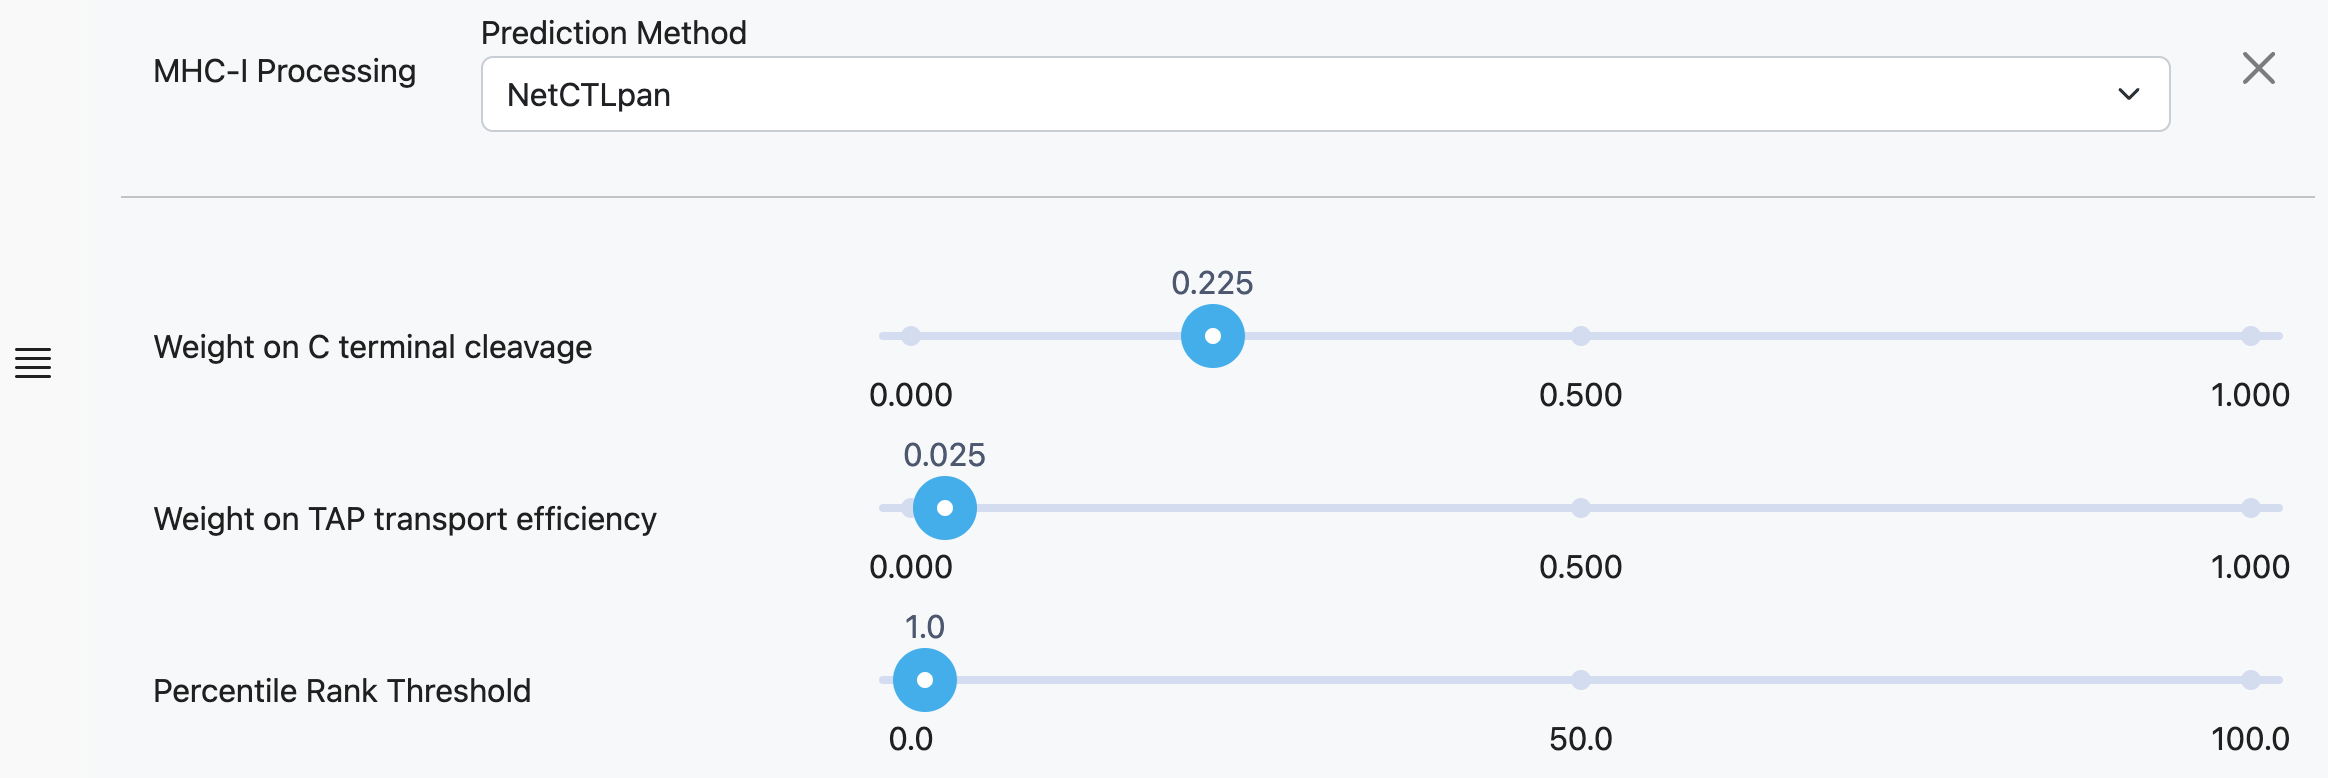
Weight on C Terminal Cleavage
Relative weight on proteasomal cleavage.
Weight on TAP Transport Tfficiency
Relative weight on TAP transport efficiency predicted using the weight matrix-based method described by Peters et al., 2003.
Percentile Rank Threshold
Percentile threshold for plotting prediction scores. This threshold can be adjusted after predictions are complete.
Results
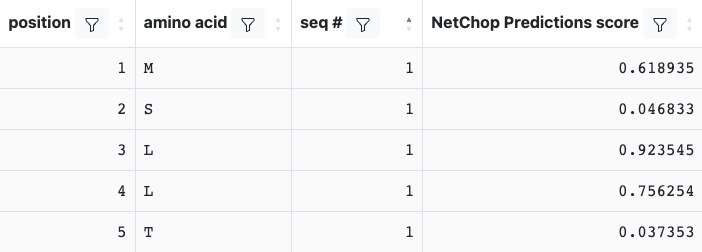
NetChop
A NetChop prediction result will include the tabular and graphical output. The table will include the NetChop Prediction Score and look similar to:
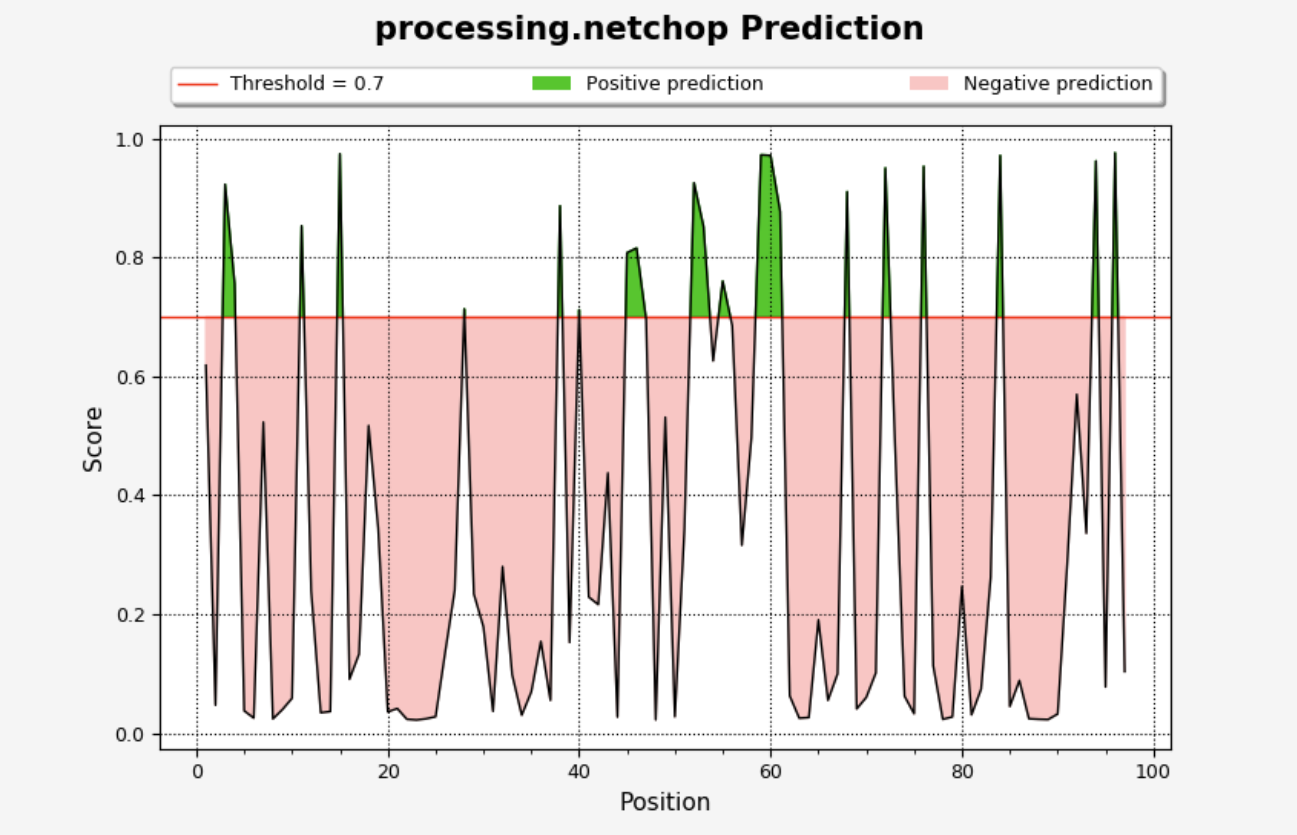
The plot will be displayed on the ‘Processing Plots’ tab and will show the NetChop score vs. residue position. Scores that are greater than the selected threshold will be displayed in green, while those lower than the threshold will be in red.
NetCTL (historic)
NetCTL (historic) will add several columns to the output table, which will look similar to:
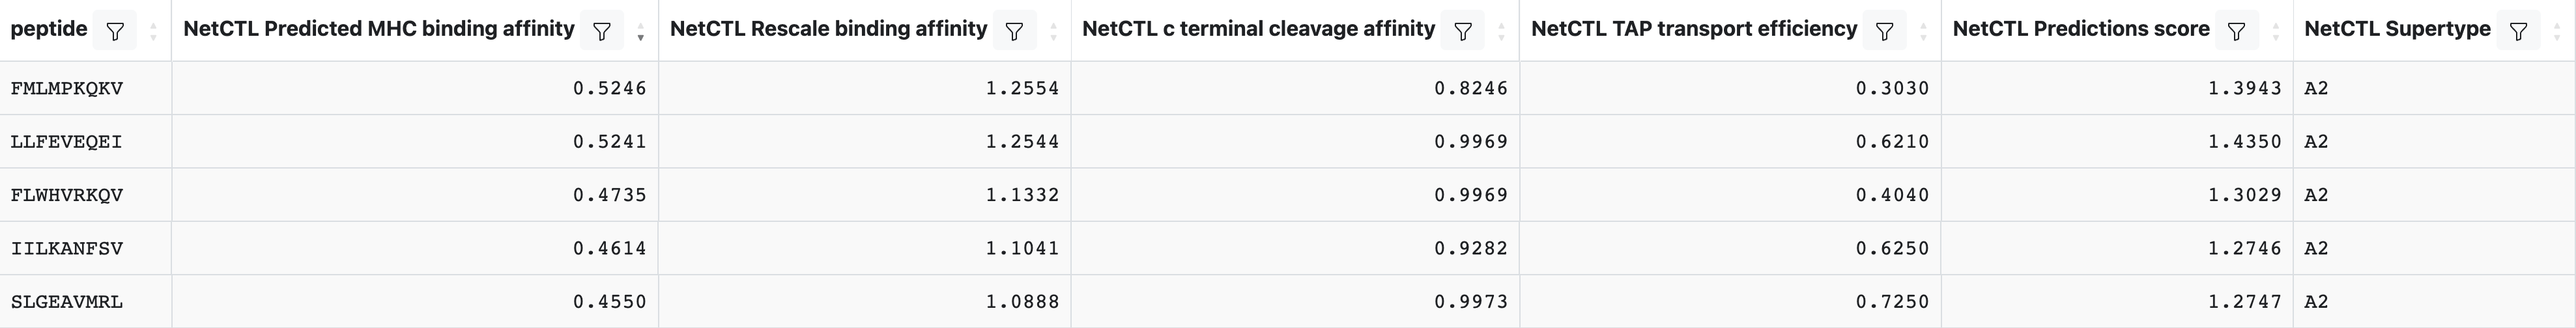
The main metric is the NetCTL (historic) Predictions score where higher indicates a stronger probability of being a naturally processed epitope. Descriptions of the additional columns can be found by clicking on ‘Display Columns’.
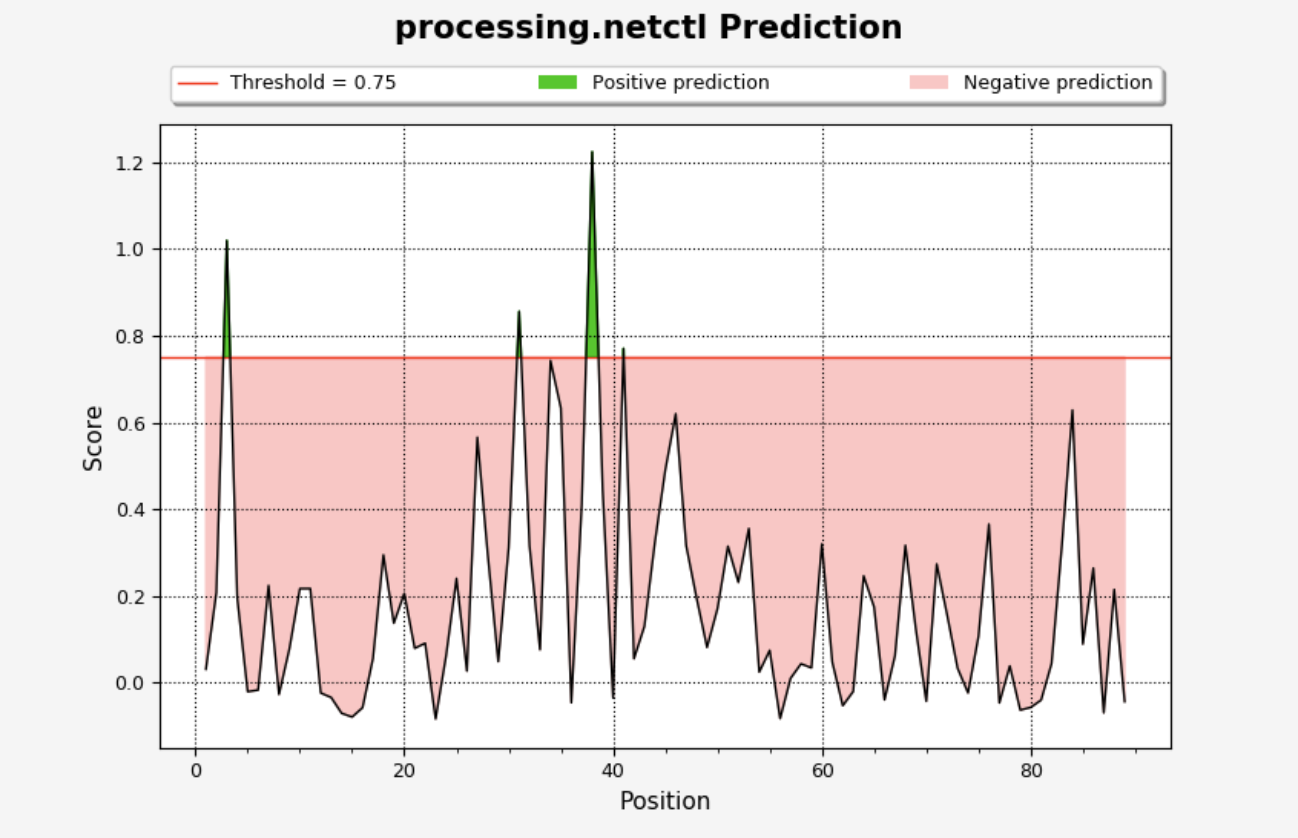
The plot will be displayed on the ‘Processing Plots’ tab and will show the NetCTL (historic) score vs. residue position. Scores that are greater than the selected threshold will be displayed in green, while those lower than the threshold will be in red.
NetCTLpan (historic)
NetCTLpan (historic) will add several columns to the output table, which will look similar to:
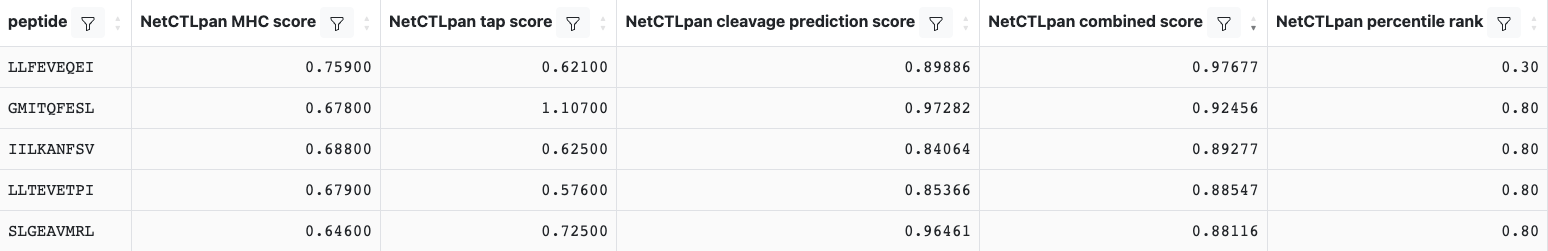
The main outputs of concern are the NetCTLpan (historic) combined score and NetCTLpan (historic) percentile rank. Descriptions of all columns may be found by clicking on ‘Display Columns’.
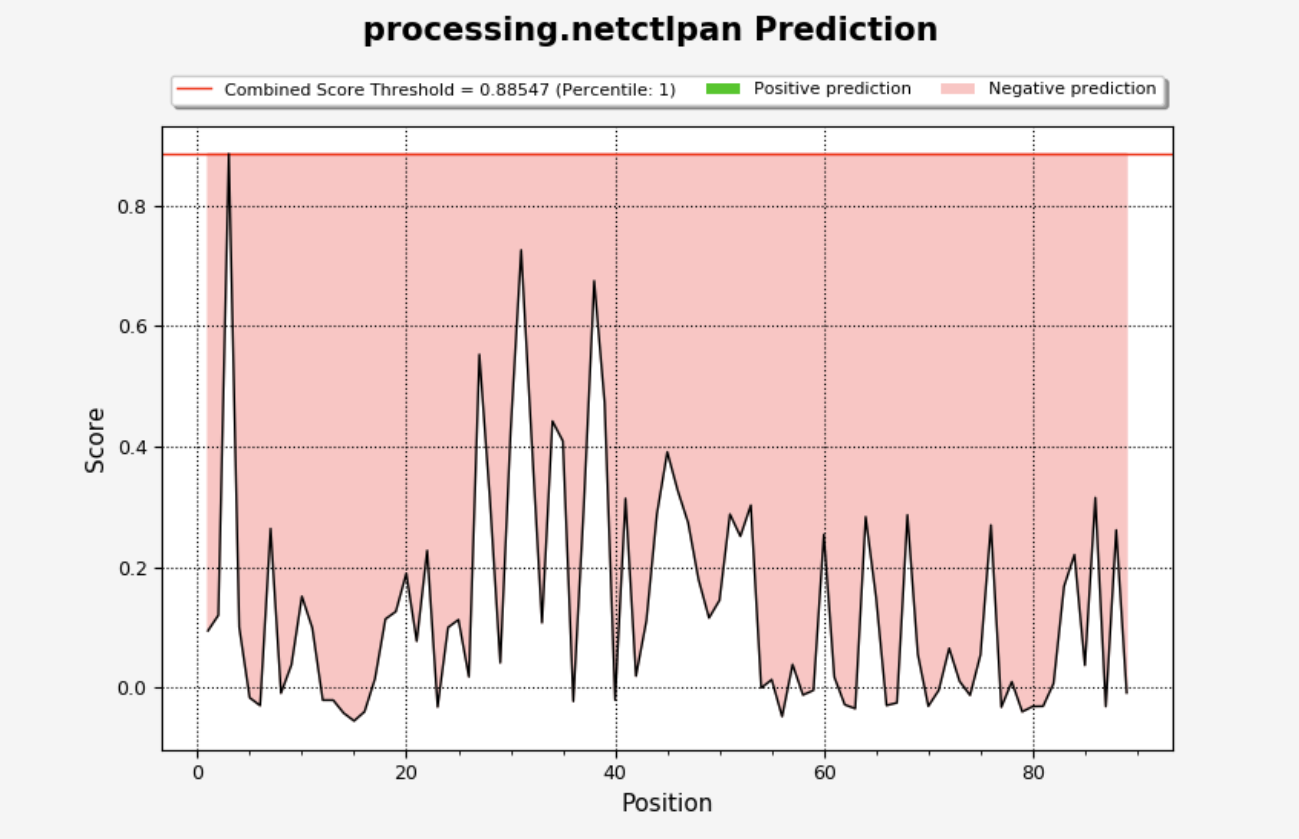
The plot will be displayed on the ‘Processing Plots’ tab and will show the NetCTLpan (historic) score vs. residue position. Scores that are greater than the selected threshold will be displayed in green, while those lower than the threshold will be in red.