B Cell - Sequence Input
The B Cell - Sequence Input tool allows for the prediction of linear B-cell epitopes from protein sequences using several different methods. The tool includes BepiPred-3.0, which utilizes advanced protein language models, alongside several classical scale-based methods.
Methods
ML-based method
BepiPred-3.0 is currently the only ML-based method available.
Bepipred Linear Epitope Prediction 3.0
Epitope probability from neural network; higher scores = more likely epitope.
The BepiPred-3.0 server predicts both linear and discontinuous B-cell epitopes from protein sequence. It uses neural networks trained on protein language embeddings of epitope and non-epitope amino acids from crystal structures. The method leverages the ESM-2 protein language model (650M parameter version,
esm2_t33_650M_UR50D) to generate numerical embeddings. These embeddings capture semantic and evolutionary information for each amino acid; the downstream neural network predicts epitope probability. A sequential smoothing (rolling mean) can be optionally used.
[DOI: 10.1002/pro.4497]
Scale-based methods
Parameters such as hydrophilicity, flexibility, accessibility, turns, exposed surface, and polarity of polypeptide chains have been correlated with the location of continuous epitopes. All prediction calculations are based on scales for each of the 20 amino acids. Each scale consists of 20 values assigned to each amino acid residue based on their relative propensity to possess the property described by the scale.
The general method for a given residue i is to compute the score using amino acids in an interval of chosen length centered around residue i. For a window size n, the i − (n−1)/2 neighboring residues on each side of residue i are used. Unless specified, the score for residue i is the average of the scale values for these amino acids. In general, a window size of 5 to 7 is appropriate for finding potentially antigenic regions.
Chou & Fasman Beta-Turn Prediction
Beta-turn propensity scale; higher scores = more turn likelihood. Turns are often found in epitope regions.
The rationale for predicting turns to predict antibody epitopes is based on Pellequer et al., Immunology Letters, 36 (1993) 83-99. The Chou and Fasman scale is commonly used to predict beta turns.
Reference: Chou PY, Fasman GD. 1978. Prediction of the secondary structure of proteins from their amino acid sequence. Adv Enzymol Relat Areas Mol Biol 47:45-148. [PMID: 364941]
Scale: Amino acid propensity values for Chou & Fasman beta-turn scale.
A |
C |
D |
E |
F |
G |
H |
I |
K |
L |
M |
N |
P |
Q |
R |
S |
T |
V |
W |
Y |
|---|---|---|---|---|---|---|---|---|---|---|---|---|---|---|---|---|---|---|---|
0.66 |
1.19 |
1.46 |
0.74 |
0.6 |
1.56 |
0.95 |
0.47 |
1.01 |
0.59 |
0.6 |
1.56 |
1.52 |
0.98 |
0.95 |
1.43 |
0.96 |
0.5 |
0.96 |
1.14 |
Emini Surface Accessibility Prediction
Surface accessibility; higher scores = more likely surface-exposed. Sn > 1.0 for hexapeptide indicates increased surface probability.
The calculation uses a surface accessibility scale as a product (not a sum) within the window. The accessibility profile is obtained using the formula Sn = (n+4+i)(0.37)−6, where Sn is the surface probability and i varies from 1 to 6. A hexapeptide with Sn > 1.0 indicates increased probability of being found on the surface.
Reference: Emini EA, Hughes JV, Perlow DS, Boger J. 1985. Induction of hepatitis A virus-neutralizing antibody by a virus-specific synthetic peptide. J Virol 55:836-839. [PMID: 2991600]
Scale: Amino acid propensity values for Emini surface accessibility.
A |
C |
D |
E |
F |
G |
H |
I |
K |
L |
M |
N |
P |
Q |
R |
S |
T |
V |
W |
Y |
|---|---|---|---|---|---|---|---|---|---|---|---|---|---|---|---|---|---|---|---|
0.49 |
0.26 |
0.81 |
0.84 |
0.42 |
0.48 |
0.66 |
0.34 |
0.97 |
0.4 |
0.48 |
0.78 |
0.75 |
0.84 |
0.95 |
0.65 |
0.7 |
0.36 |
0.51 |
0.76 |
Karplus & Schulz Flexibility Prediction
Flexibility (B-factor mobility); higher scores = more flexible regions, often antigenic.
A flexibility scale was constructed from temperature B factors of the α-carbons of 31 proteins of known structure. The calculation is similar to the classical method. The center is the first amino acid of the six-amino-acid window; three scales describe flexibility instead of one.
Reference: Karplus PA, Schulz GE. 1985. Prediction of chain flexibility in proteins. Naturwissenschaften 72:212-213. [Naturwissenschaften]
Kolaskar & Tongaonkar Antigenicity
Semi-empirical antigenicity (~75% accuracy); higher scores = higher predicted antigenicity.
A semi-empirical method using physicochemical properties and frequencies in known segmental epitopes. Application to many proteins has shown ~75% accuracy for predicting antigenic determinants.
Reference: Kolaskar AS, Tongaonkar PC. 1990. A semi-empirical method for prediction of antigenic determinants on protein antigens. FEBS Lett 276:172-174. [PMID: 1702393]
Scale: Amino acid propensity values for Kolaskar & Tongaonkar antigenicity.
A |
C |
D |
E |
F |
G |
H |
I |
K |
L |
M |
N |
P |
Q |
R |
S |
T |
V |
W |
Y |
|---|---|---|---|---|---|---|---|---|---|---|---|---|---|---|---|---|---|---|---|
1.064 |
1.412 |
0.866 |
0.851 |
1.091 |
0.874 |
1.105 |
1.152 |
0.93 |
1.25 |
0.826 |
0.776 |
1.064 |
1.015 |
0.873 |
1.012 |
0.909 |
1.383 |
0.893 |
1.161 |
Parker Hydrophilicity Prediction
Hydrophilicity from HPLC retention; higher scores = more hydrophilic, surface-exposed, and antigenic.
A hydrophilicity scale based on peptide retention times during HPLC on a reversed-phase column. A window of seven residues is used. The mean of the seven values is assigned to the fourth residue (i+3) in the segment.
Reference: Parker JM, Guo D, Hodges RS. 1986. New hydrophilicity scale derived from high-performance liquid chromatography peptide retention data: correlation of predicted surface residues with antigenicity and X-ray-derived accessible sites. Biochemistry 25:5425-5432. [PMID: 2430611]
Scale: Amino acid propensity values for Parker hydrophilicity.
A |
C |
D |
E |
F |
G |
H |
I |
K |
L |
M |
N |
P |
Q |
R |
S |
T |
V |
W |
Y |
|---|---|---|---|---|---|---|---|---|---|---|---|---|---|---|---|---|---|---|---|
2.1 |
1.4 |
10.0 |
7.8 |
−9.2 |
5.7 |
2.1 |
−8.0 |
5.7 |
−9.2 |
−4.2 |
7.0 |
2.1 |
6.0 |
4.2 |
6.5 |
5.2 |
−3.7 |
−10.0 |
−1.9 |
Input Data
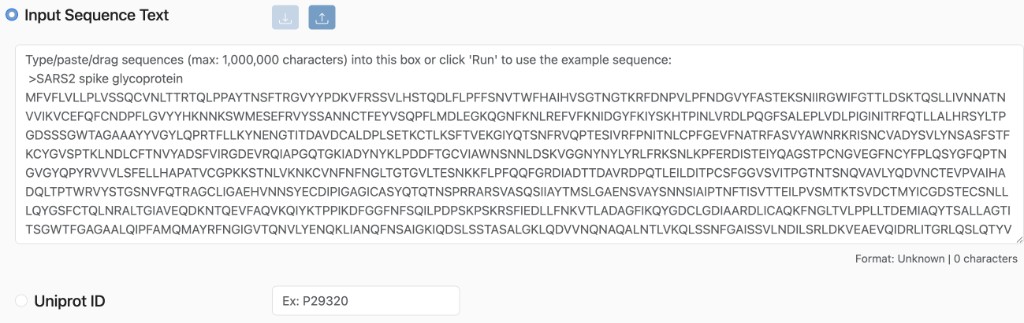
Sequence Text: Enter protein sequences directly into the input field. This supports:
FASTA Format: Standard text-based format (e.g.,
>header\nSEQUENCE).Plain Text: Raw amino acid sequences (e.g.,
MKAIL...). * UniProt IDs: To use a UniProt ID:Check the UniProt ID box.
Enter the accession ID (e.g.,
P02185) to automatically retrieve the sequence.
Note
Due to the scales for each of the 20 amino acids, the tool does not accept ambiguity codes such as X, B, Z, and J.
File uploading is currently not supported in the UI.
Parameter Selection
Method Selection
Select the desired prediction method from the dropdown menu. Bepipred Linear Epitope Prediction 3.0 is the latest method.
Method-Specific Parameters
Bepipred 3.0:
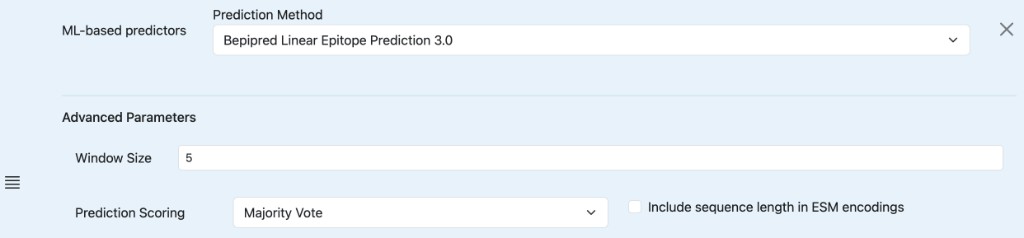
Window Size: The number of amino acids considered in the sliding window.
Prediction Scoring:
Majority Vote: Uses an ensemble of models to vote on the prediction.
Variable Threshold: Uses a specific threshold value for prediction.
Include sequence length in ESM encodings: Adds sequence length as a feature to the ESM-2 embeddings (equivalent to
-add_seq_lenin CLI).Threshold: (If Variable Threshold is selected) Adjust the sensitivity/specificity of the prediction. Higher thresholds result in fewer but more confident predictions.
Default: 0.1512 (Corresponds to specificity > 0.85)
scale-based methods (Chou-Fasman, Emini, Karplus & Schulz, Kolaskar-Tongaonkar, Parker):
Window Size: The number of amino acids considered in the sliding window.
Default: 7 (except Emini which defaults to 6)
Center Position: (Implicit in window size) The score is assigned to the central residue of the window.
Window Size Defaults and Ranges
| Method | Default window size | Window size range |
|---|---|---|
| Emini | 6 | 6 |
| Parker | 7 | 1-25 |
| Karplus & Schulz | 7 | 7 |
| Kolaskar & Tongaonkar | 7 | 1-25 |
| Chou & Fasman | 7 | 1-25 |
| BepiPred-3.0 | 9 | 1-50 |
Results
Tabular Results
The following tables are available:
Residue Table: A detailed view of scores for each individual residue (center position of the window) in the sequence. Columns can be shown or hidden via “Display Columns”. Columns are grouped by method to mirror the Display Columns dialog.
Core
seq #: Index of the input sequence among all input sequences.
position: Position of the amino acid residue within the input sequence (1-based index).
residue: Single-letter amino acid code at the specified position.
Bcell_sequence (scores and residue relative ranks per method)
BepiPred-3.0
bepipred score: Epitope probability from neural network. Higher scores = more likely epitope.
bepipred residue relative rank: BepiPred relative rank of particular residue compared to all residues of the input sequence.
Chou & Fasman
chou & fasman score: Beta-turn propensity. Turns often in epitope regions; higher = more turn likelihood.
chou & fasman residue relative rank: Chou & Fasman relative rank of particular residue compared to all residues of the input sequence.
Emini
emini score: Surface accessibility (product-based, sliding window). Higher = more surface-exposed.
emini residue relative rank: Emini relative rank of particular residue compared to all residues of the input sequence.
Karplus & Schulz
karplus & schulz score: Flexibility from B-factor mobility. Higher = more flexible, often antigenic.
karplus & schulz residue relative rank: Karplus & Schulz relative rank of particular residue compared to all residues of the input sequence.
Kolaskar & Tongaonkar
kolaskar & tongaonkar score: Semi-empirical antigenicity (~75% accuracy). Higher = higher antigenicity.
kolaskar & tongaonkar residue relative rank: Kolaskar & Tongaonkar relative rank of particular residue compared to all residues of the input sequence.
Parker
parker score: Hydrophilicity from HPLC retention. Higher = more hydrophilic, surface-exposed.
parker residue relative rank: Parker relative rank of particular residue compared to all residues of the input sequence.
Assignments (binary classification: epitope (E) or non-epitope (n) at selected thresholds)
bepipred assignment
chou & fasman assignment
emini assignment
karplus & schulz assignment
kolaskar & tongaonkar assignment
parker assignment
Linear Epitope Table: Summarizes contiguous stretches of predicted epitopes.
Linear Epitope Table columns
Start: The starting position of the predicted epitope.
End: The ending position of the predicted epitope.
Peptide: The amino acid sequence of the predicted epitope.
Length: The length of the predicted epitope.
Method: (When multiple methods are run) The prediction method that produced the epitope.
Average Score: The average score across the residues in the predicted epitope region for the method that predicted it.
Note
Only regions with at least 5 consecutive epitope residues are shown in the linear epitope table.
Sequence Table: One row per input sequence with aggregate statistics (e.g., sequence length, number of predicted epitopes). Available columns depend on the selected methods; use the app’s Display Columns to show or hide metrics.
Bcell Sequence Plots
Score profiles along the sequence; each method has its own plot.
Example: Chou & Fasman prediction plot
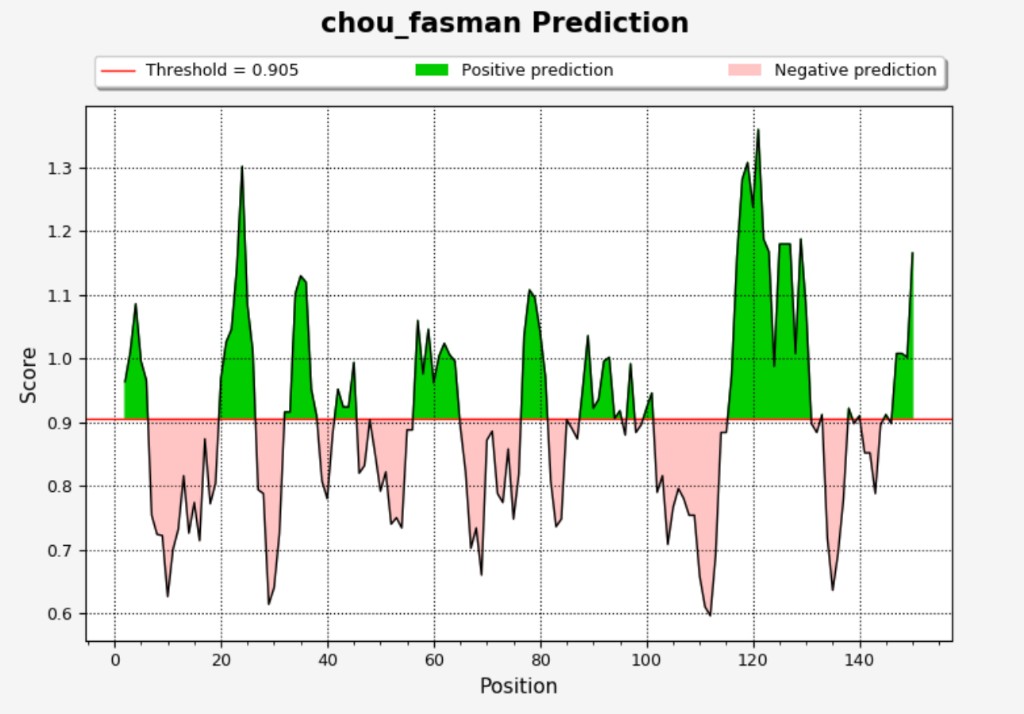
Axes: X-axis = residue position; Y-axis = score averaged in the specified window for each residue.
Elements: Score line; red threshold line; green shading (positive prediction); pink shading (negative prediction).
Interpreting Scores
For all methods, higher scores indicate regions more likely to be epitopes (or epitope-correlated properties). BepiPred-3.0 and Kolaskar & Tongaonkar directly predict epitope likelihood or antigenicity; Chou & Fasman, Emini, Karplus & Schulz, and Parker predict structural or physicochemical properties (beta-turns, surface accessibility, flexibility, hydrophilicity) that correlate with epitope location.
Note
The scale-based methods do not predict epitopes per se—they guide researchers to regions worth further exploration.
The Residue Table displays per-residue scores and assignments.
Score columns (e.g.,
bepipred score,chou & fasman score): Use these with percentile ranks to compare residues.Assignment columns (E or n): Epitope vs non-epitope at the selected threshold.
Interpretation: Higher scores correspond to residues more likely to be part of an epitope.
The Bcell Sequence Plots tab shows score profiles along the sequence.
Example: Chou & Fasman prediction plot
See Bcell Sequence Plots above for axes and elements (score line, threshold, green/pink shading). Higher peaks indicate stronger propensity; use the plot to identify contiguous high-scoring regions that may warrant further investigation.
Per-method details
BepiPred-3.0
Interpretation: Higher scores = greater likelihood of epitope.
Score and threshold details
Score: Epitope probability (0.0–1.0) from the FFNN trained on ESM-2 embeddings (
esm2_t33_650M_UR50D).Threshold: Default 0.1512 (specificity > 0.85). Adjust to trade sensitivity for specificity. Optimized for MCC on validation data.
Chou & Fasman
Interpretation: Higher scores = greater turn propensity. Beta turns are often found in antigenic regions (Pellequer et al.).
Score and threshold details
Score: Beta-turn propensity scale.
Threshold: No fixed threshold — use relative peaks.
Emini
Interpretation: Higher scores = more likely surface-exposed.
Score and threshold details
Score: Surface accessibility (product-based, 6-residue window).
Threshold: Sn > 1.0 for hexapeptide indicates increased surface probability.
Karplus & Schulz
Interpretation: Higher scores = more flexible regions, often antigenic.
Score and threshold details
Score: Flexibility (B-factor–based mobility; 6-residue window, three scales).
Threshold: No fixed threshold.
Kolaskar & Tongaonkar
Interpretation: Higher scores = higher predicted antigenicity. Based on physicochemical properties and frequencies in known epitopes.
Score and threshold details
Score: Semi-empirical antigenicity (~75% accuracy).
Threshold: No fixed threshold.
Parker
Interpretation: Higher scores = more hydrophilic, more likely surface-exposed and antigenic.
Score and threshold details
Score: Hydrophilicity (HPLC retention times; 7-residue window, score on 4th residue).
Threshold: No fixed threshold.