B Cell - Structure Input
The B Cell - Structure Input tool predicts linear and discontinuous antibody epitopes based on a protein antigen’s 3D structure.
Methods
General basis: Antigenicity correlates with solvent accessibility and flexibility. Discontinuous epitopes require 3D structure; structure-based methods use surface topology, protrusion, and spatial features. The tool offers two approaches: geometry-based (ElliPro) and machine-learning-based (DiscoTope-3.0).
ElliPro
Protrusion Index; higher scores = more solvent-exposed. Protruding regions are often antigenic.
Geometry-based method: approximates protein shape as an ellipsoid; PI = percentage of atoms enclosed when a residue first lies outside. Discontinuous epitopes are formed by clustering residues above a threshold by spatial distance.
Reference: Ponomarenko J, Bui HH, Li W, Fusseder N, Bourne PE, Sette A, Peters B. 2008. ElliPro: a new structure-based tool for the prediction of antibody epitopes. BMC Bioinformatics 9:514. [PMID: 19055730]
Technical details
ElliPro implements a modified version of Thornton’s method. The ellipsoid can vary in size (e.g., 90% ellipsoid includes 90% of atoms); ElliPro uses each residue’s center of mass (Thornton used Cα only). Clustering proceeds in three steps (primary → secondary → tertiary) until distinct non-overlapping clusters form. Benchmark: AUC 0.732 when the best significant prediction was considered per protein.
DiscoTope 3.0
Epitope propensity from inverse folding; higher scores = more likely B-cell epitope. Works on solved and AlphaFold-predicted structures.
ML-based method: uses ESM-IF1 embeddings plus RSA, pLDDT, and sequence features. XGBoost ensemble; scores calibrated for antigen length and surface area bias.
Reference: Høie MH, Gade FS, Johansen JM, Würtzen C, Winther O, Nielsen M, Marcatili P. 2024. DiscoTope-3.0: Improved B-cell epitope prediction using inverse folding latent representations. Front Immunol. [DOI: 10.3389/fimmu.2024.1322712]
Technical details
ESM-IF1 generates 512-dimensional structure representations. Features: ESM-IF1 embeddings, relative surface accessibility (Shrake-Rupley), pLDDT (AlphaFold confidence), antigen length, sequence one-hot encoding. Trained with positive-unlabeled learning. Outperforms BepiPred-3.0, ScanNet, and SEMA on external test set for both predicted and solved structures.
Input Data
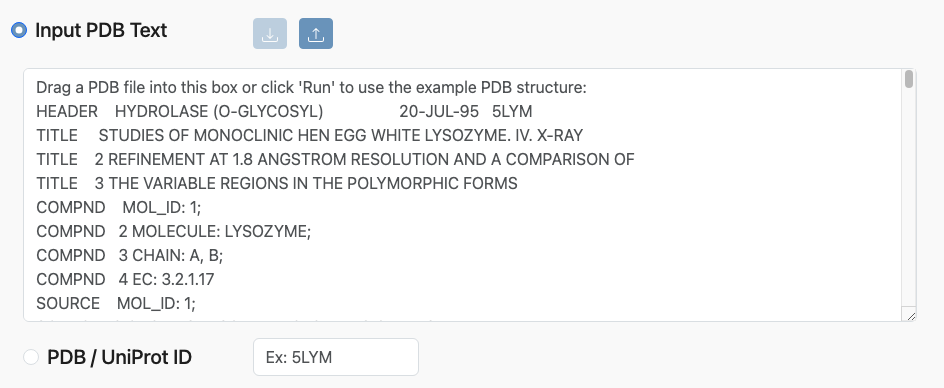
The tool requires a 3D structure of the antigen. This can be provided in two ways:
Input PDB Text: Paste the full text content of a PDB file directly into the input box.
PDB / UniProt ID: Enter the 4-character Protein Data Bank (PDB) identifier (e.g.,
5LYM) or a UniProt accession number (e.g.,P0DTC2). The tool will retrieve the corresponding structure from the Protein Data Bank or AlphaFold database.
Note
Chain selection (PDB Chain) is required for prediction.
For DiscoTope-3.0, structure quality (e.g., pLDDT for AlphaFold models) affects prediction accuracy.
Parameter Selection
Method Selection
Select one or more prediction methods to run: DiscoTope 3.0 and ElliPro. Additional parameters for each method appear based on the selection.
Common Parameters
Structure Type: Indicate whether the input structure is a solved structure (e.g., from X-ray crystallography) or an AlphaFold-predicted model. This informs the tool about expected confidence levels and may affect certain calculations (e.g., pLDDT handling).
PDB Chain: Specify the chain ID of the antigen within the PDB structure (e.g.,
A). This is required for prediction.
Method-Specific Parameters
Note: The threshold parameter appears after the prediction is made.
ElliPro:
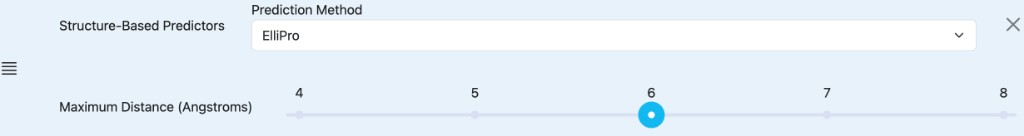
Maximum Distance (Å): Maximum distance between residue centers for clustering into discontinuous epitopes. Default: 6 Å (optimal in benchmark).
DiscoTope 3.0:
Epitope Confidence Threshold: Calibrated score cutoff for binary epitope assignment. Higher thresholds yield fewer but more confident predictions.
Higher confidence: 1.50
Moderate confidence: 0.90 (Default)
Lower confidence: 0.40
Results
Tabular Results
The following tables are available:
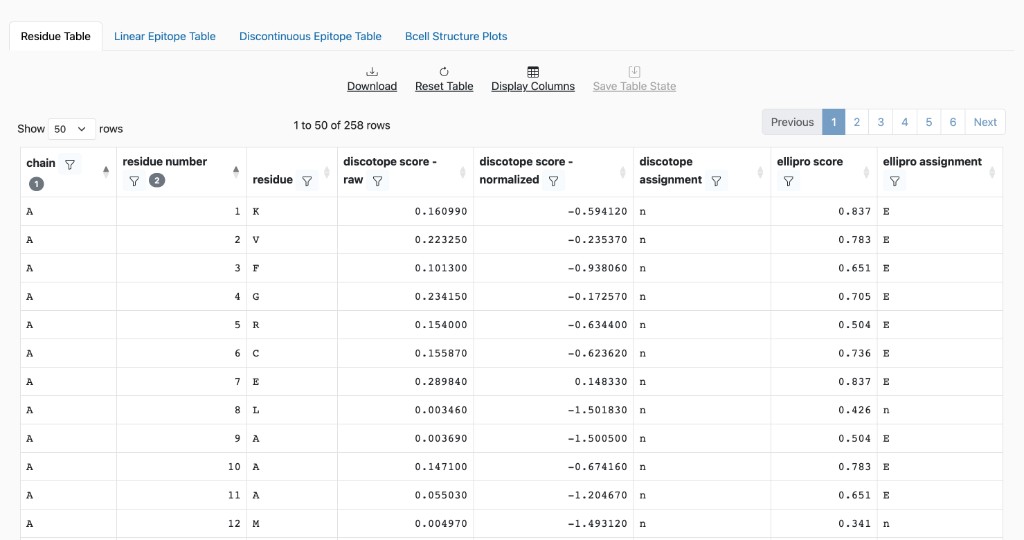
Residue Table: Per-residue scores and assignments. Use “Display Columns” to show or hide columns; columns are grouped by method. Table controls: Download, Reset Table, Display Columns, Save Table State, and pagination.
Core
chain: Chain identifier of the protein structure.
residue number: Residue position in the protein sequence.
residue: Single-letter amino acid code at the specified position.
DiscoTope
discotope score - raw: Raw prediction score from the model. Higher scores indicate greater likelihood of B-cell epitope.
discotope score - normalized: Calibrated score, normalized for protein length and surface area.
discotope assignment: Binary column indicating whether a residue is above (E) or below (n) the normalized score threshold.
RSA: Relative surface accessibility (Shrake-Rupley, normalized using Sander scale).
pLDDTs: AlphaFold model confidence score for this residue (0–100). Set to 100 for solved structures.
ElliPro
ellipro score: Protrusion Index (PI) measuring how much a region protrudes from the protein’s 3D structure. Higher scores indicate greater solvent exposure.
ellipro assignment: Binary column indicating whether a residue is above (E) or below (n) the score threshold.
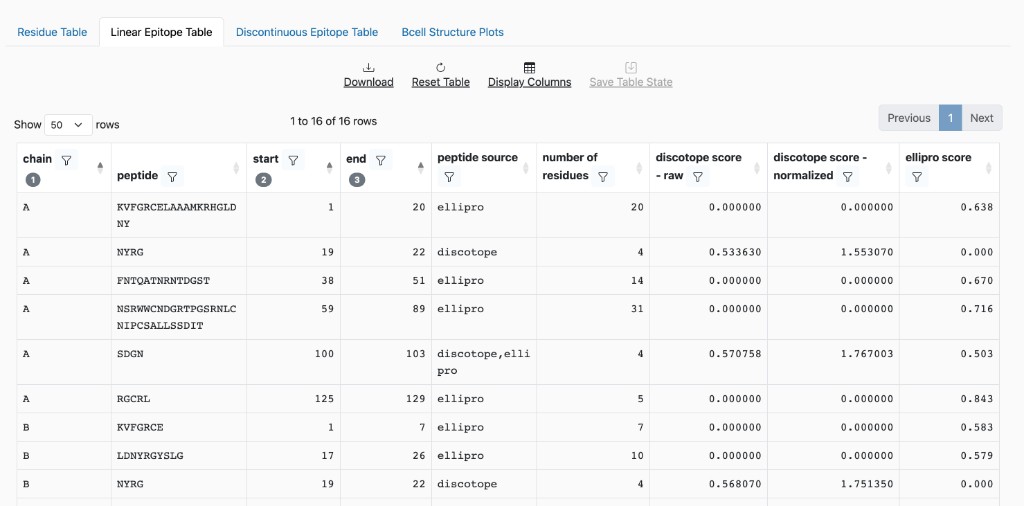
Linear Epitope Table: Contiguous stretches of predicted epitopes. When both methods run: ElliPro-only epitopes have DiscoTope scores as 0; DiscoTope-only have ElliPro as 0; both show scores from each.
Linear Epitope Table columns
chain: The protein chain ID.
peptide: The amino acid sequence of the epitope.
start: The starting residue position (1-based).
end: The ending residue position (1-based).
peptide source: Method(s) that predicted the epitope (
ellipro,discotope, ordiscotope,elliprowhen both agree).number of residues: Length of the peptide (
end - start + 1).discotope score - raw, discotope score - normalized: DiscoTope scores (0 when DiscoTope did not predict this epitope).
ellipro score: ElliPro Protrusion Index (0 when ElliPro did not predict this epitope).
Note
Only epitopes that meet the minimum length requirement for the selected method are shown:
| Method | Minimum length |
|---|---|
| DiscoTope, ElliPro | 4 |
Discontinuous Epitope Table: Lists predicted discontinuous epitopes (clusters of residues). Primarily populated by ElliPro results.
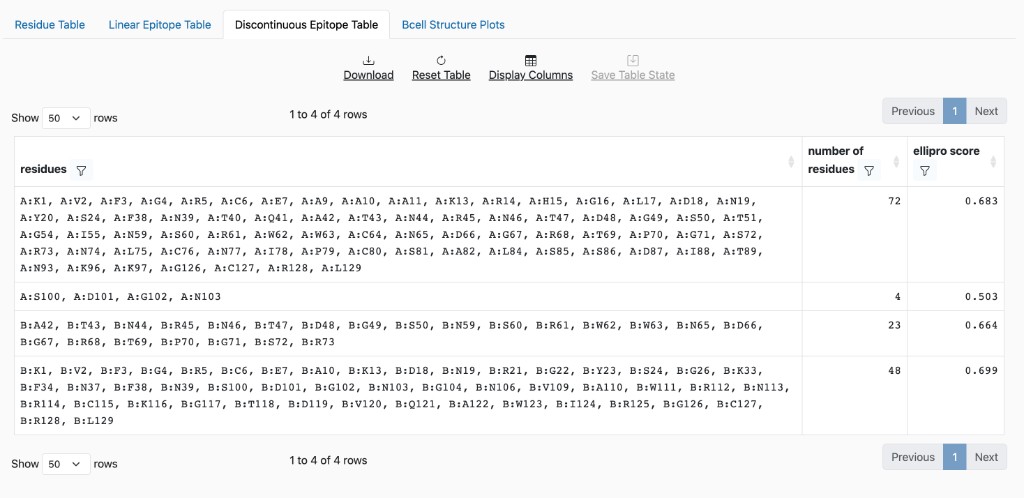
Discontinuous Epitope Table columns
residues: Comma-separated list in format
CHAIN:Letter:Number(e.g.,A:K1,B:S100).number of residues: Total count of residues in the epitope.
ellipro score: ElliPro Protrusion Index (0–1); higher scores indicate greater epitope likelihood.
Bcell Structure Plots
Visualizations of the predictions. Use the Chain dropdown to select which protein chain (e.g., A, B) to display.
3D Structure View: Interactive viewer with epitopes highlighted on the protein structure.
Score Plots: Line graphs of prediction scores along the sequence; each method (DiscoTope, ElliPro) has its own plot.
Example: DiscoTope prediction plot
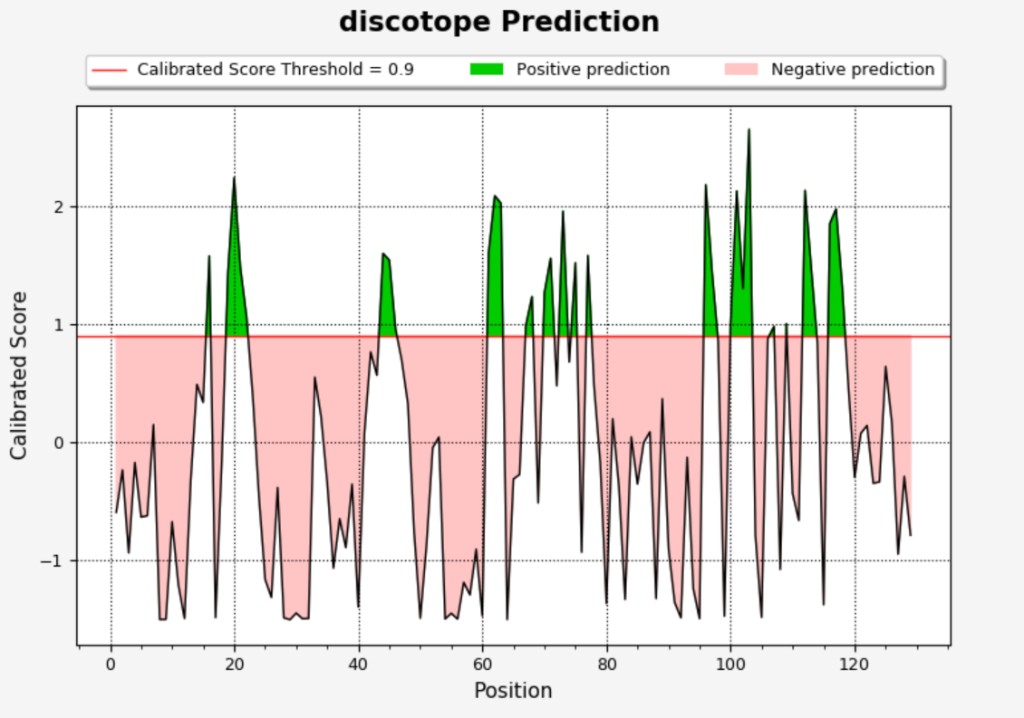
Axes: X-axis = residue position; Y-axis = Calibrated Score (DiscoTope) or Protrusion Index (ElliPro).
Elements: Score line; red threshold line; green shading (positive prediction); light red shading (negative prediction).
Interpreting Scores
For all methods, higher scores indicate regions more likely to be epitopes (or epitope-correlated). ElliPro is geometry-based (protrusion from the protein surface); DiscoTope-3.0 is machine-learning-based (inverse folding and structural features).
Note
Structure-based predictions guide research toward regions worth further exploration; they do not definitively predict epitopes.
The Residue Table displays per-residue scores and assignments.
Score columns (e.g.,
discotope score - raw,ellipro score): Use these to compare residues across the structure.Assignment columns (E or n): Epitope vs non-epitope at the selected threshold.
Interpretation: Higher scores correspond to residues more likely to be part of an epitope.
The Bcell Structure Plots tab shows score profiles along the sequence and an interactive 3D structure view. Use the Chain dropdown to switch between protein chains.
Example: DiscoTope prediction plot
See Bcell Structure Plots above for axes and elements (score line, threshold, green/red shading). Higher peaks indicate stronger epitope propensity; use the plot and 3D view to identify contiguous or spatially clustered high-scoring regions.
Per-method details
ElliPro
Interpretation: Higher PI = more protruding, more solvent-exposed. Protruding regions are often antigenic (Thornton et al.).
Score and threshold details
Score: Protrusion Index (0–1); percentage of protein atoms enclosed in the ellipsoid when the residue first lies outside. Based on residue center of mass.
Threshold: Minimum PI (S) and maximum distance (R) for clustering; default R = 6 Å.
DiscoTope 3.0
Interpretation: Higher score = greater epitope propensity. Calibrated for antigen length and surface area.
Score and threshold details
Score: XGBoost ensemble average; calibrated for length and surface bias. Uses ESM-IF1 embeddings, RSA, pLDDT, and sequence.
Threshold: 1.50 (higher confidence), 0.90 (moderate, default), 0.40 (lower confidence). Higher thresholds yield fewer but more confident predictions.